Countries like Germany, Switzerland and Japan have benefitted from an explosive growth in capital, but the US still dominates and the UK risks being left behind, our in-depth analysis shows.

You can also listen to a discussion about the findings from this analysis, led by editor (and author of this analysis) Thierry Heles and senior editor Maija Palmer in a special episode of our Beyond the Breakthrough podcast or by clicking play below.
The last five years have seen a sharp rise in the amount of money raised by university spinouts globally, with the number of funding rounds and the dollars raised doubling. With this explosion of interest in spinouts, US dominance in exits has dwindled but remained the primary player in investments. Countries like Japan have seen sharp rises in spinout funding in recent years helping to provide a counter to the US, although the UK, following Brexit, has seen its share of funding fall. And while healthcare and IT remain the two biggest sectors, energy-related spinouts have returned to favour amid a fuel crisis and the climate emergency.
Double the money coming in
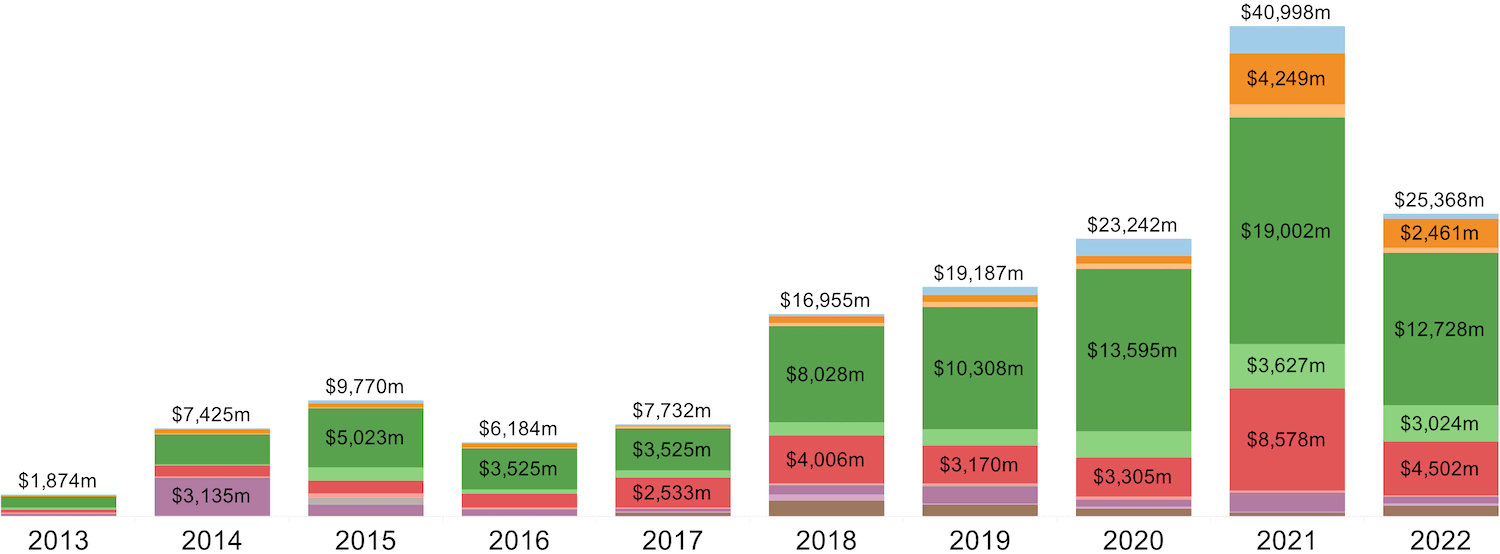
More than $158bn across 8,042 investments — that is the amount of equity financing raised globally by the spinouts we have tracked at Global University Venturing in the decade from our launch in 2013 to the end of 2022.
They are staggering numbers today, but they are even more impressive given where the sector was at even five years ago when we published our first longitudinal analysis.
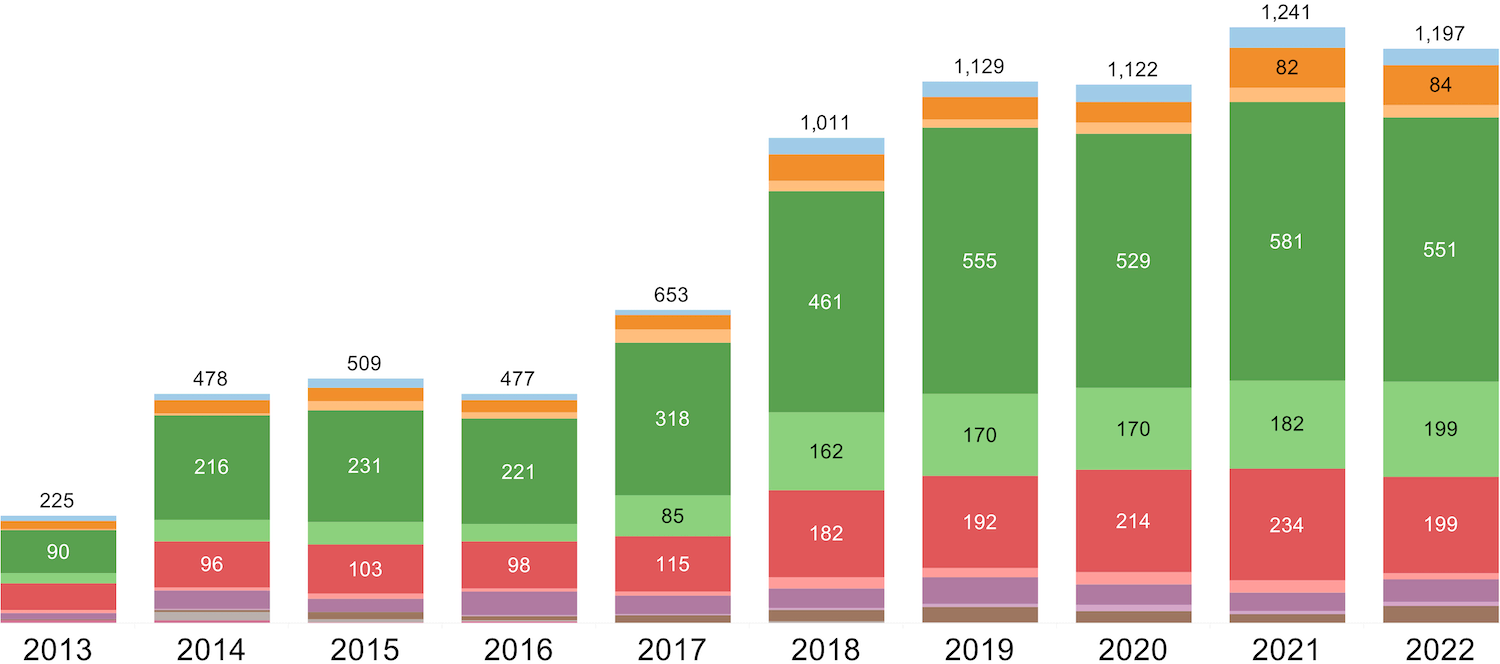
Indeed, this is a tale of two halves. Up until 2017 the number of fundraising rounds for university spinout companies never went higher than 653 a year and never crossed the $10bn mark annually. Since 2018, there have never been fewer than 1,000 funding deals a year and in the last three years, the annual amount of capital raised never dropped below $20bn.
2021 clearly stands out as an outlier and we have seen investment levels come down in 2022, even though the venture capital slowdown has been impacting spinouts less than startups generally. That said, 2022 has still seen an increase over 2021 despite a market pullback and macroeconomic pressures.
Value of investments

Number of investments
The return of the energy spinout
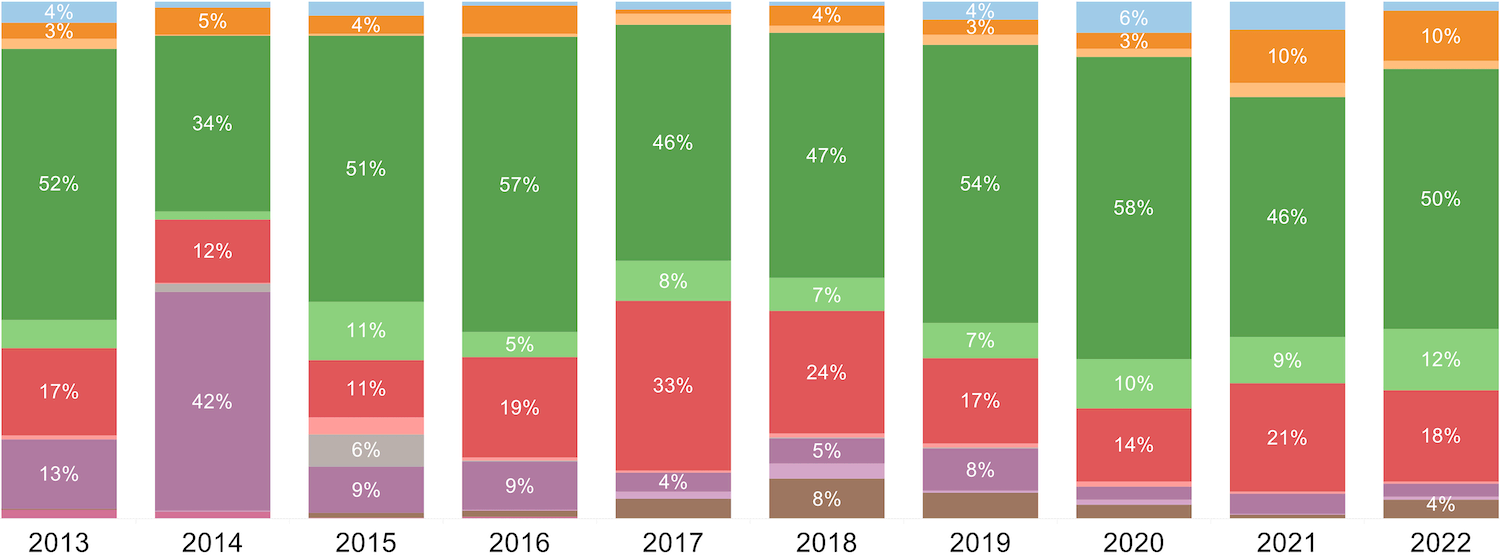
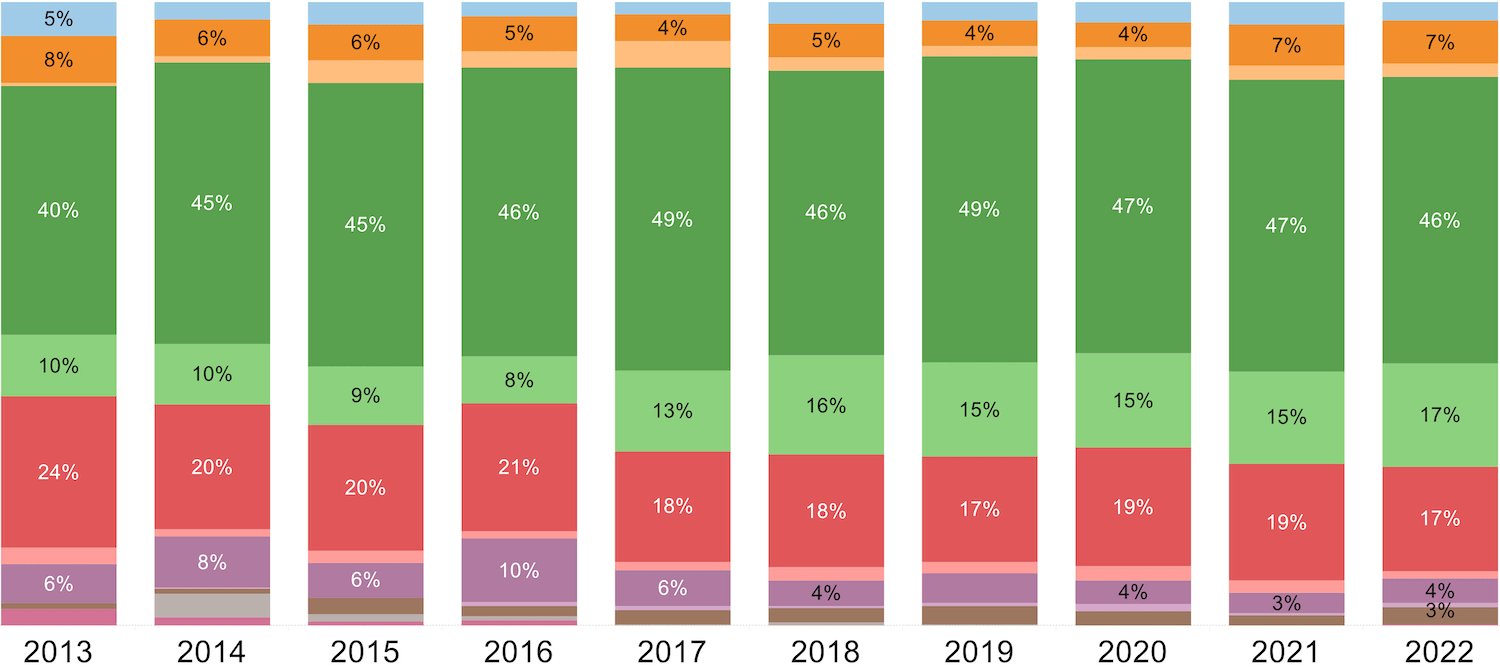
The money going to university spinouts to some extent follows macroeconomic trends. Consumer-focused spinouts took in slightly more money in 2020 and 2021. But apart from a modest rise in 2020, healthcare spinouts did not actually become the focus you might have expected during a pandemic. They received 58% of capital in 2020, but this isn’t much more than the relative proportion that the sector secured in 2016. And the relative number of investments in healthcare spinouts has actually remained very steady over the past decade at an average 46%.
The lack of a large healthcare spike during the pandemic is, in many ways, evidence of the historic strength of university research commercialisation in life sciences. Two of the covid vaccine producers, Moderna and BioNTech, had already gone public by the time the pandemic started: Moderna in December 2018 and BioNTech ten months later. And Vaccitech, responsible for University of Oxford’s covid-19 vaccine technology, had raised $41.6m to develop a vaccine for Middle East Respiratory Syndrome, also caused by a type of coronavirus, by January 2018.
IT has also historically been an active sector for technology transfer. Like healthcare, there is a clear route to market and just as life sciences have patents, there is copyright law to protect a software developer’s intellectual property. IT spinouts have maintained a stable share of the investments over the years but the relative amounts secured by the sector have varied wildly, from 12% in 2014 to as much as 33% in 2017.
But it is the energy sector that stands out. Its share of deals is approaching the historic high it reached in 2013 and the proportion of capital received has more than tripled since then. In 2021, that meant nearly $4.25bn across 82 deals and in 2022 it was $2.46bn across 84 investments. The increased focus is partially dictated by Russia’s invasion of Ukraine, which showed the western world the importance of energy security, and partially thanks to the realisation that the climate crisis isn’t a distant nightmare but a reality for many countries already.
Fusion energy is a clear focus here for investors, from University of Washington’s Zap Energy attracting $160m in its series C round in June 2022 to the enormous $1.8bn series B round for Massachusetts Institute of Technology’s Commonwealth Fusion Systems (CFS) in December 2021.
Value of investments by sector in percentages
Number of investments by sector in percentages
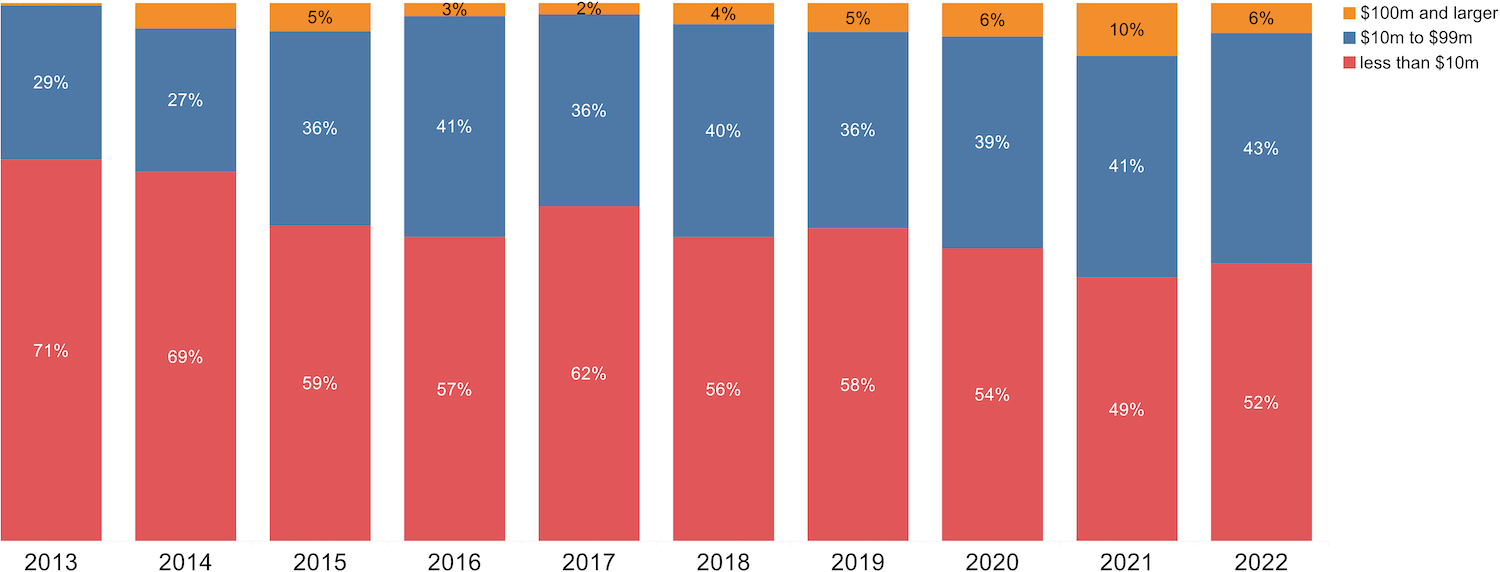
More than half of rounds are for less than $10m
CFS’s series B was emblematic of the 2021 venture capital hype that led to outsized rounds — 10% of spinout funding rounds raised more than $100m that year. This was a temporary blip, however, and such large rounds have only ever made up a small percentage of investments in spinouts. Apart from 2021 (and only just), small transactions of less than $10m have made up more than half of all rounds over the past decade. And for most of the decade, mid-size rounds worth $10m to $99m have hovered around the 40% mark.
These numbers imply that spinouts often are bought out early before they can raise massive sums.
Round size distribution in percentages
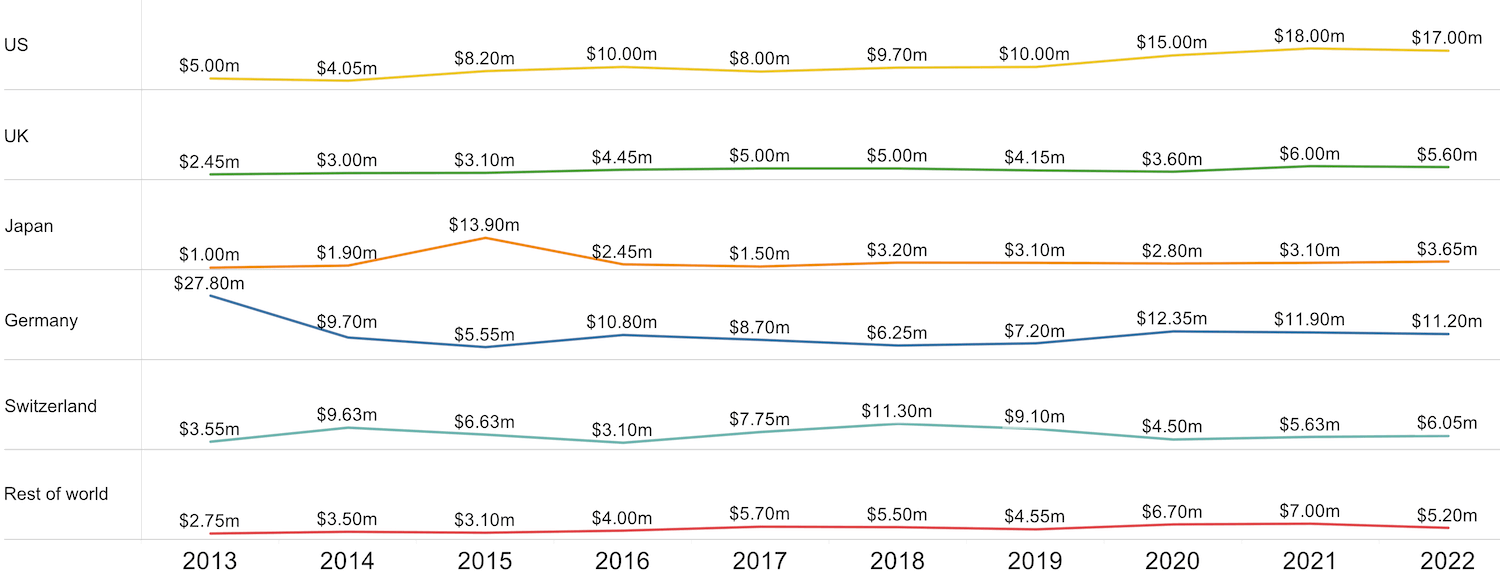
Most of the larger rounds have gone to US spinouts, with the median deal size for spinouts in that region rising from $5m in 2013 to $17m in 2022. The US also saw the median size go up in 2020, the first year of the pandemic, when the UK, Japan and Switzerland all saw a decrease.
It’s worth mentioning one caveat about the German numbers, which appear strangely high in 2013. However, half of all rounds at the time were undisclosed amounts and a similar story emerges for Japan in 2015, when 43% of transactions were undisclosed figures.
Median deal sizes by top five countries and rest of the world
The rise of Japan — and fall of the UK?
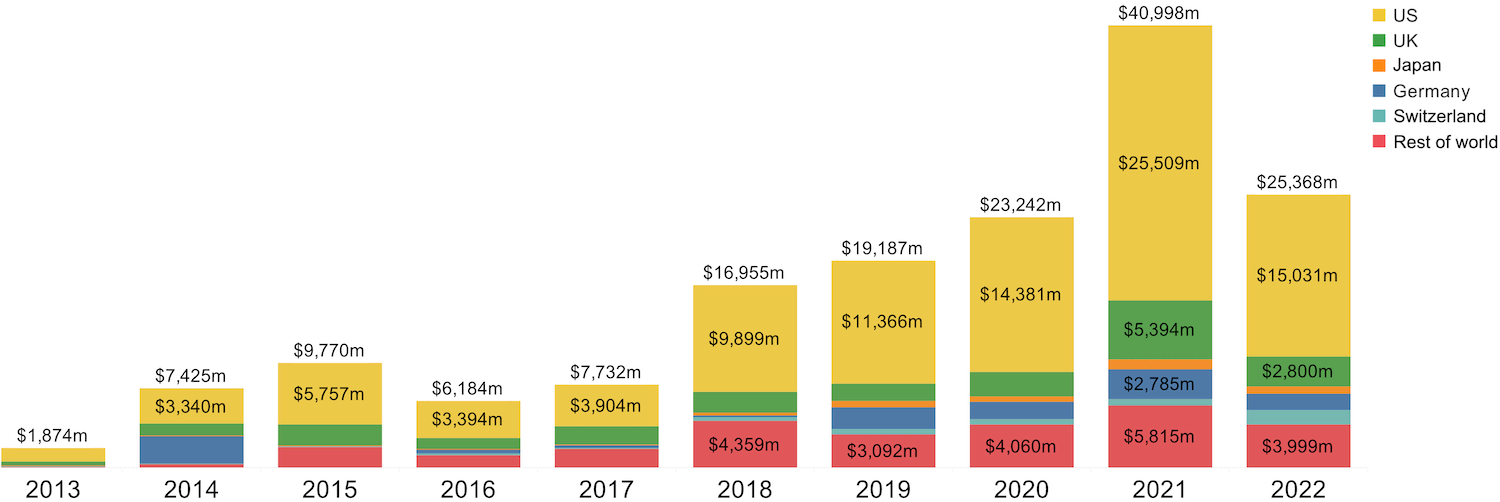
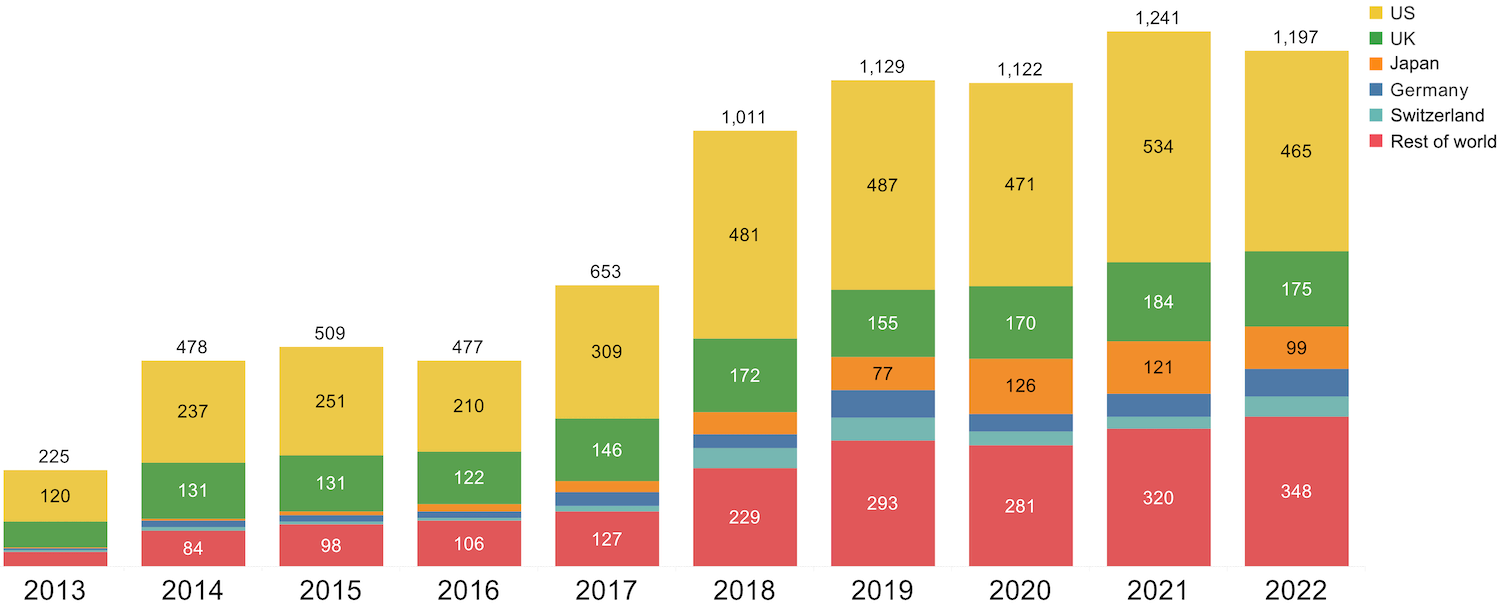
In absolute terms, the US has been the leader both in terms of the number of deals and the amount of cash raised throughout the whole period. In fact, in 2021, US spinouts alone raised more than the global total in a regular year. However, the proportion of capital raised by US-based companies actually remained the same year-on-year from 2020: 62%.
Japan, in particular, has been slowly but surely stepping up its game since 2013, when a national effort to create more tech transfer-friendly regulatory frameworks began to increase the number of new spinouts and university venture funds, including the relatively recent Waseda University Ventures. The long-established University of Tokyo Edge Capital Partners even participates in rounds internationally, for example co-leading investment in University of Oxford’s quantum computing spinout Oxford Quantum Circuits last year. It may still be early days, but our prediction is that Japan will increasingly be a force to be reckoned with on the international stage — if the country can overcome its tendency to always remain a little stuck in the past.
The UK, on the other hand, appears to have been left behind. The country’s share of deals reached a high of 26% in 2015 and 2016 but has dropped markedly since then to 15% for the past three years. More investment has gone into roughly the same number of deals, but the UK’s proportion of global capital has fallen from a high of 21% in 2017 to as low as 8% in 2019 and still only 11% in 2022. The country appears to be struggling to build the “science superpower” it has aspirations to become.
Ending easy access to the EU’s single market — larger than that of the US by some 100m citizens — may be partly responsible, as bigger sums of capital have gone to spinouts with potential to dominate large geographies. This same pressure is seen in the wider UK economy, forecast by the International Monetary Fund to be the only G7 one that will shrink this year and even more than that of sanctions-hit Russia.
Value of investments by top five countries and rest of the world
Number of investments by top five countries and rest of the world
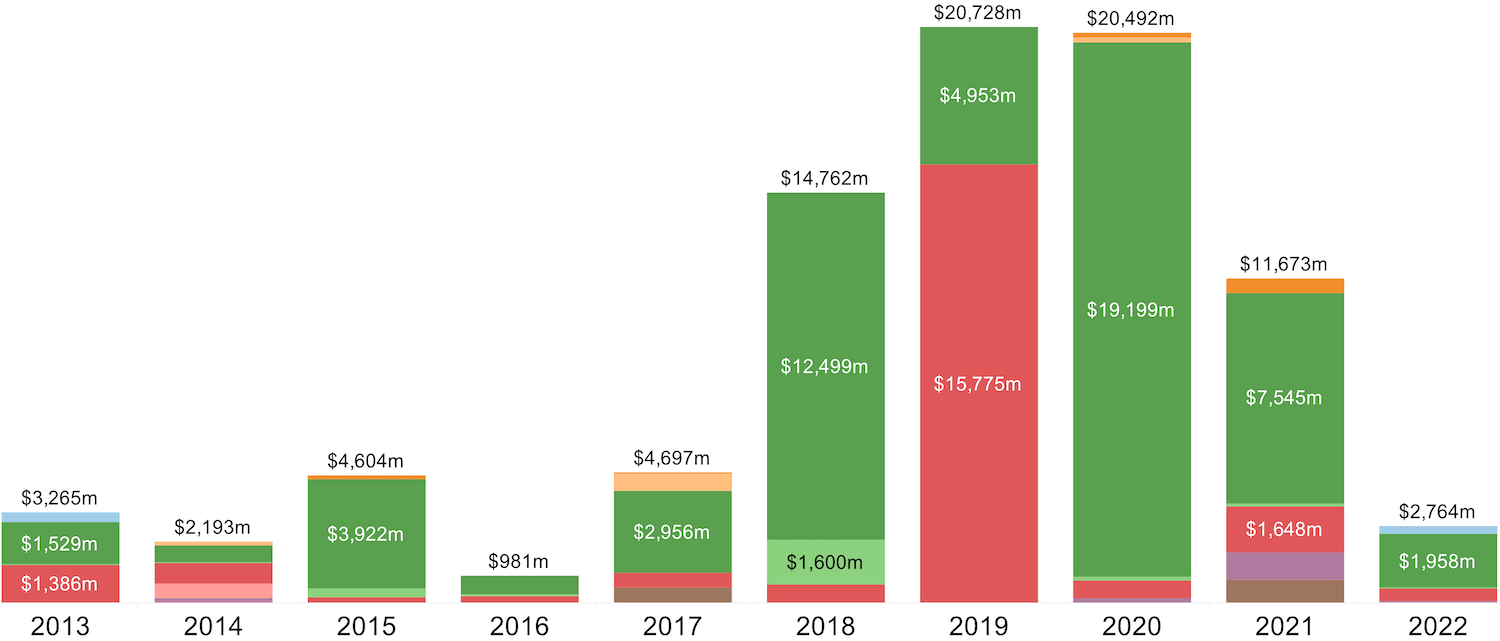
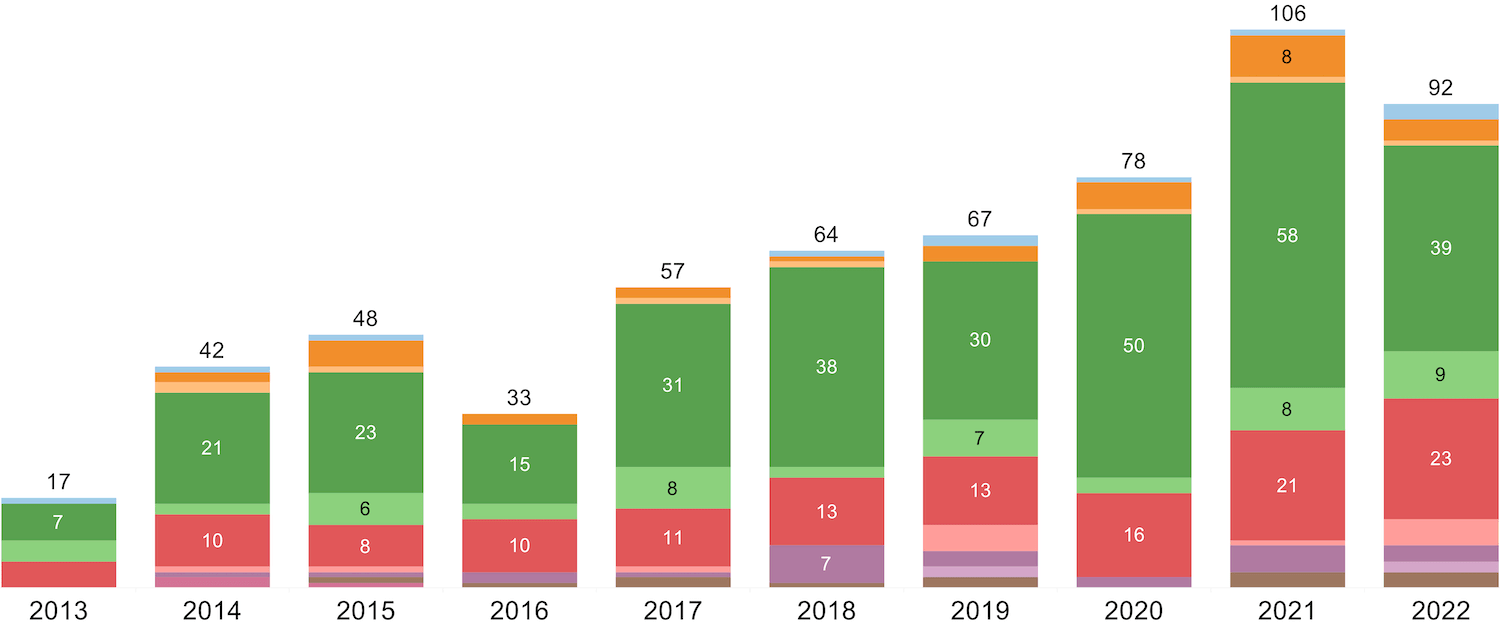
Exits rise — and then fall again
The number of exits for university spinout companies had been on an upward trajectory since 2016, but this came to a halt last year. The total number of exits only dropped from 106 in 2021 to 92 last year, but there was a much sharper fall in the amount of money generated. In 2021 the money raised through exits fell 43% to $11.67bn and 2022 saw an even sharper drop to $2.76bn.
As GUV observed in its 2022 annual review, part of the blame lies with a shift to mergers and acquisitions where prices paid are often undisclosed, rather than exits via a stock market listing. But it still feels like a big readjustment in expectations for spinout shareholders. Only 2014 and 2016 returned less money to founders and investors.
Value of exits
Number of exits
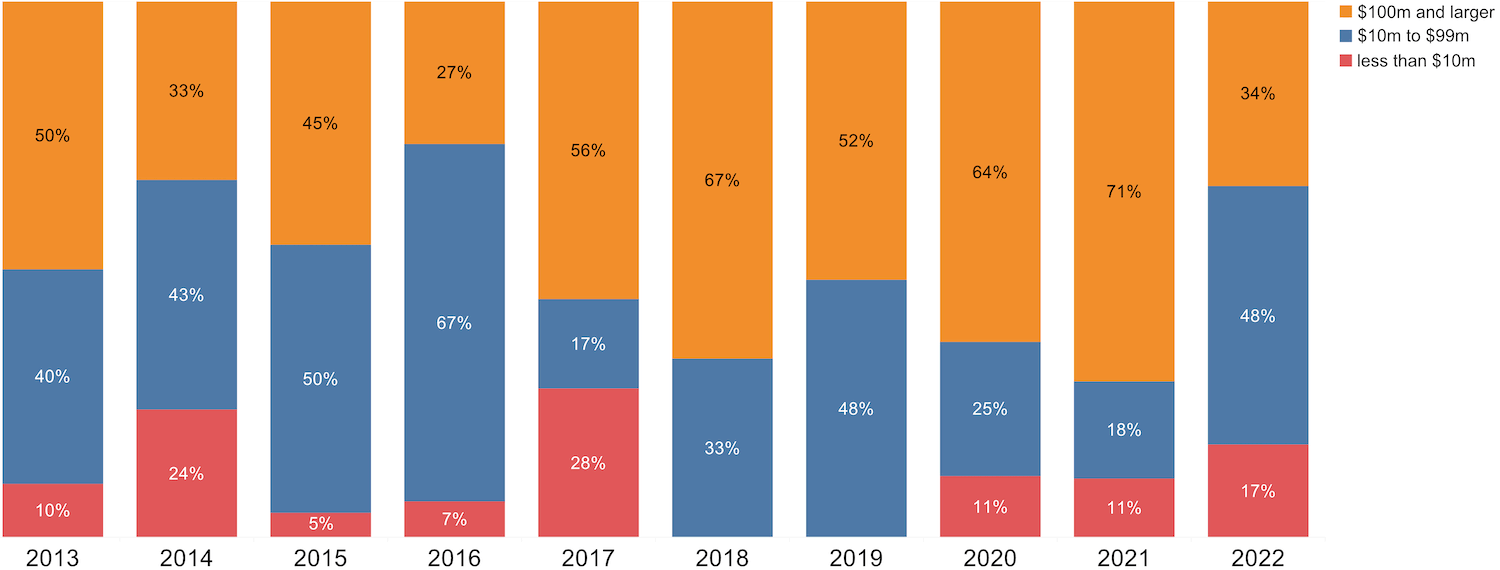
Where amounts paid were disclosed, or the exit was via the public markets, there were considerably more mid-size and small transactions in 2022 than in any year since 2016, with those worth at least $100m making up just over a third. Some 17% of exits made less than $10m.
Distribution of exits by size in percentages
The UK fared relatively better in terms of exits than it did in spinout funding, with 2022 seeing UK spinouts increasing their share of global exit dollars. It was the highest percentage since 2016 when a crashing pound made UK-based spinouts a cheap buy for overseas firms. More money returning to founders and investors could benefit the ecosystem in the long term, if founders plough some of this back into new spinouts and ventures, as Harry Destecroix did with the proceeds from his Bristol University spinout Ziylo.
End of US exit dominance?
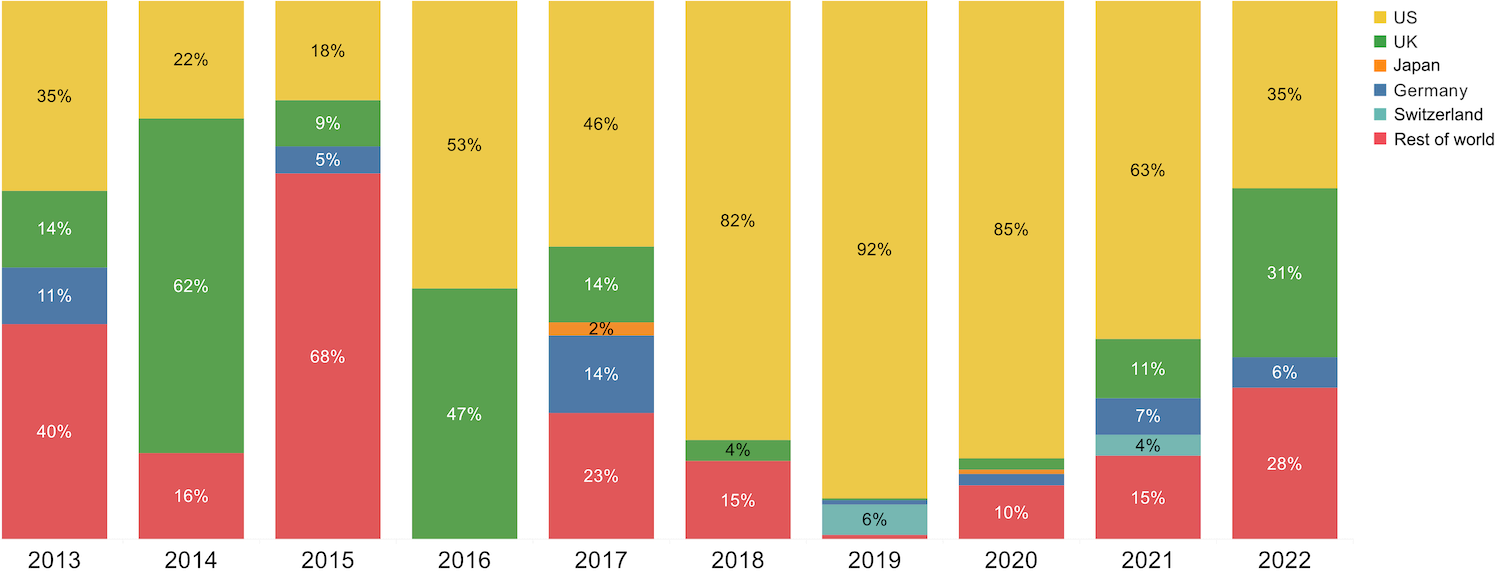
US-based spinouts, on the other hand, have gone from dominating exits in 2019 (when they accounted for 92% of the money generated) to being responsible for just 35% of exit dollars in 2022. It remains a large proportion for one country — the largest still, in fact — but it also shows that spinouts elsewhere are becoming increasingly appealing both for buyers and public markets.
Number of exits by top five countries and rest of world in percentages
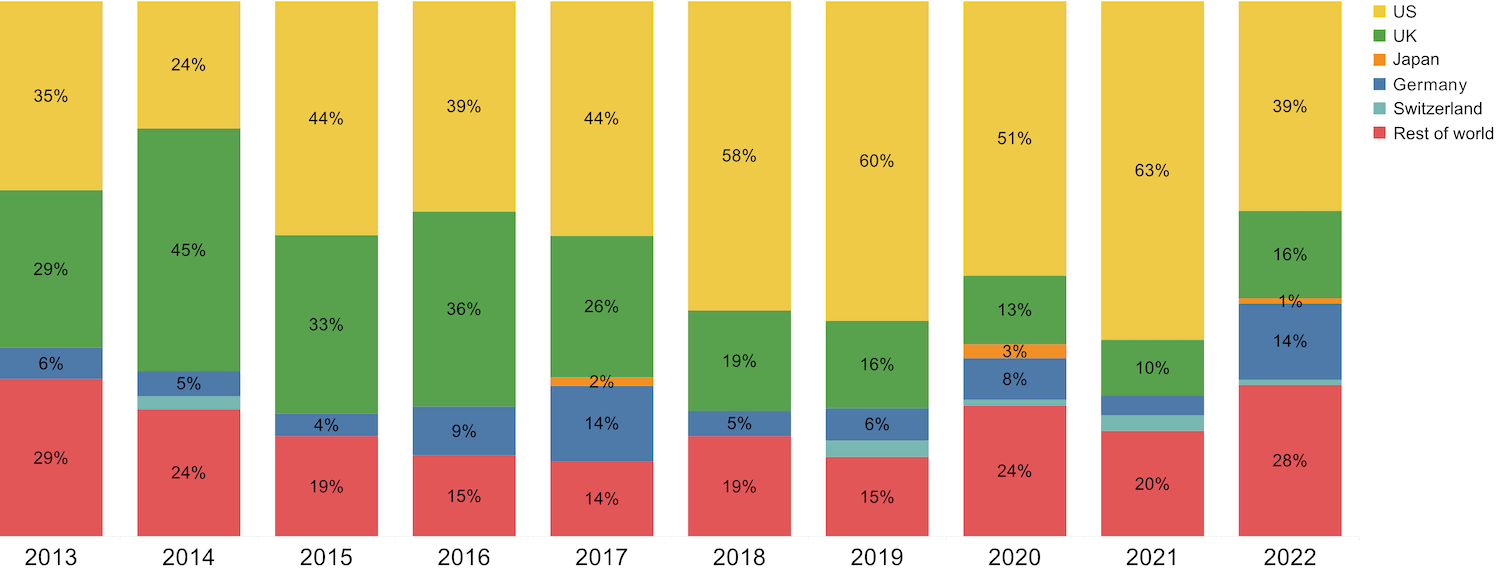
Value of exits by top five countries and rest of world in percentages
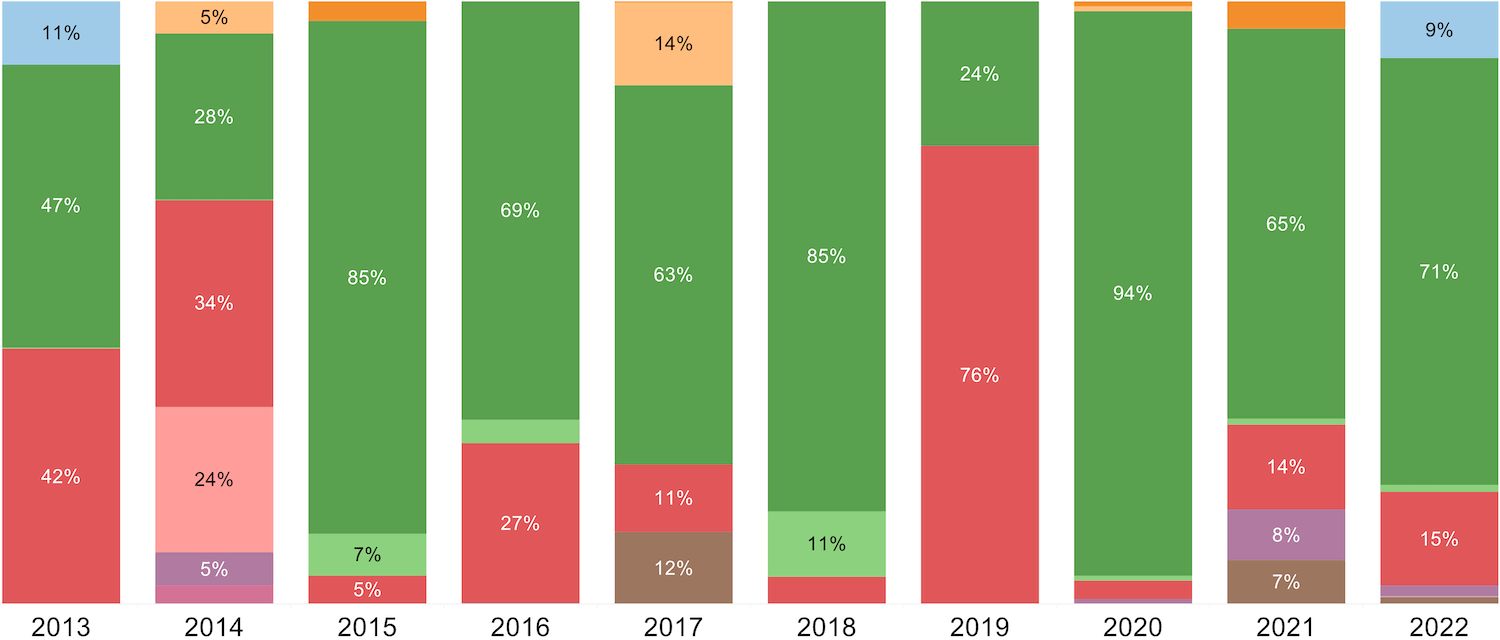
Looked at by sector, healthcare spinouts continue to be an impressive force among exits, with IT also delivering solid exits (including the $15.7bn acquisition of Stanford University’s data visualisation platform Tableau by cloud computing firm Salesforce in 2019). And it should surprise no one that in 2020, healthcare exits made up nearly 94% of all exits.
Value of exits by sector in percentages
Looking ahead
The US is likely to continue to be the world leader in spinout funding for some time, especially as continental European spinouts struggle to raise larger sums. But it is promising that international players like University of California, Berkeley’s SkyDeck incubator have established a base in Europe (Milan, Italy, in SkyDeck’s case) and the EU’s European Innovation Council has been seriously stepping up activities. Clusters like those in Munich, thanks in large part to TU Munich’s startup hub UnternehmerTUM and related venture capital fund UVC Partners, are also helping to put the old continent on the innovation map.
The UK may still be figuring out its solo role outside the European Union, but nobody should write the country off — its researchers are highly capable and determined, its entrepreneurial culture is relatively strong and its domestic investors like IP Group and Oxford Science Enterprises have the calibre to build more and more unicorns. And international investors haven’t exactly stopped backing spinouts on the island.
Ignore Japan at your own peril: if it maintains this pace of growth in another decade’s time it will be a dominant force in spinouts.
The rest of the world, too, from Australia and Chile to Morocco and Singapore, is catching up with the US thanks to passionate tech transfer leaders and increasingly sophisticated investors like Uniseed, Main Sequence Ventures or UM6P Ventures.
The past decade was a time of rapid growth and change in tech transfer and spinouts — and the ride is far from over yet.