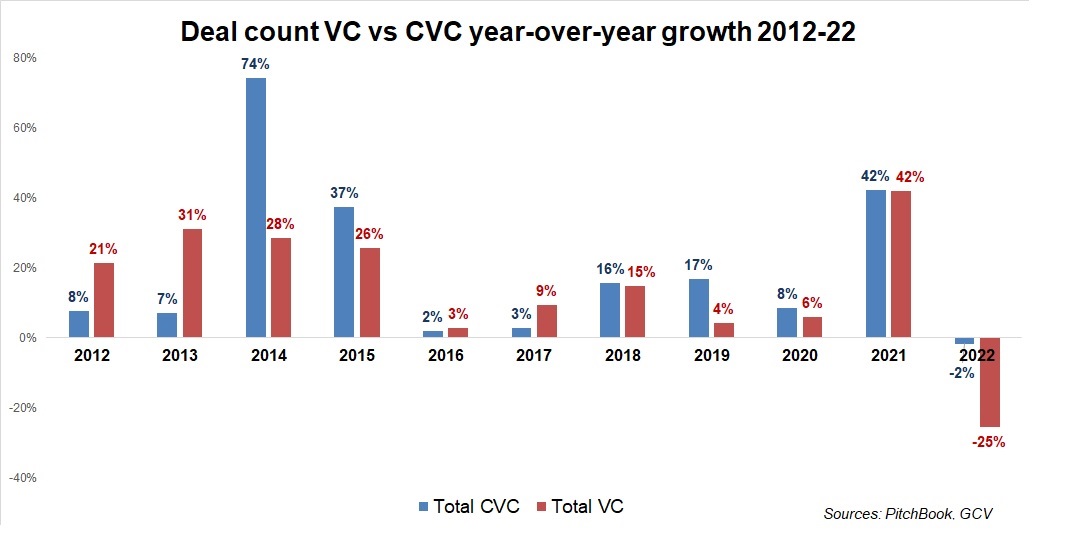
Corporate-backed VC deals fell just 2% in 2022 vs a 25% fall for venture capital overall. A record number of new corporate funds were created.
- CVC deal numbers fall 2% vs 25% for VC overall
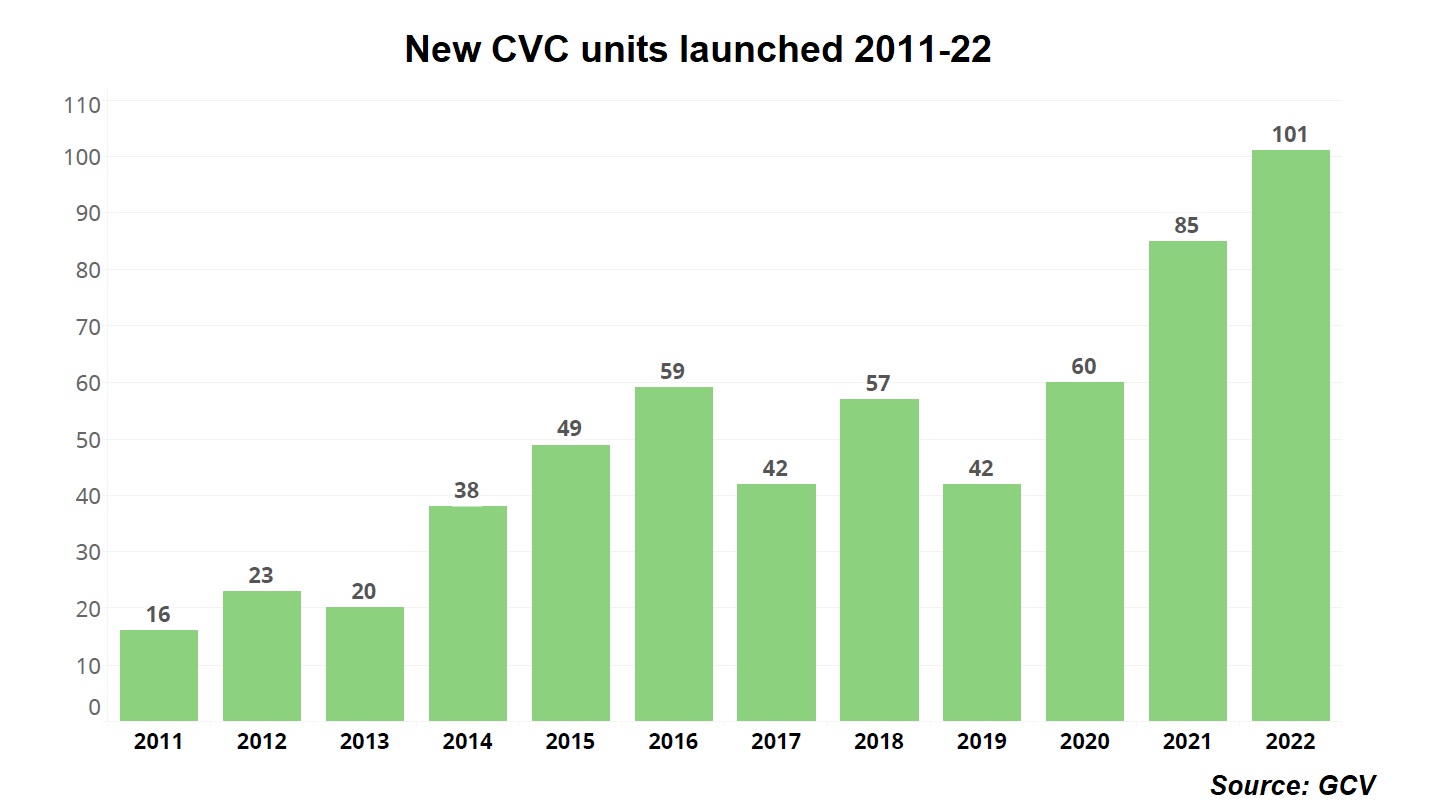
- Record 101 new CVC units created in 2022
- UK. France, Germany, Singapore and Canada see a rise in CVC deals
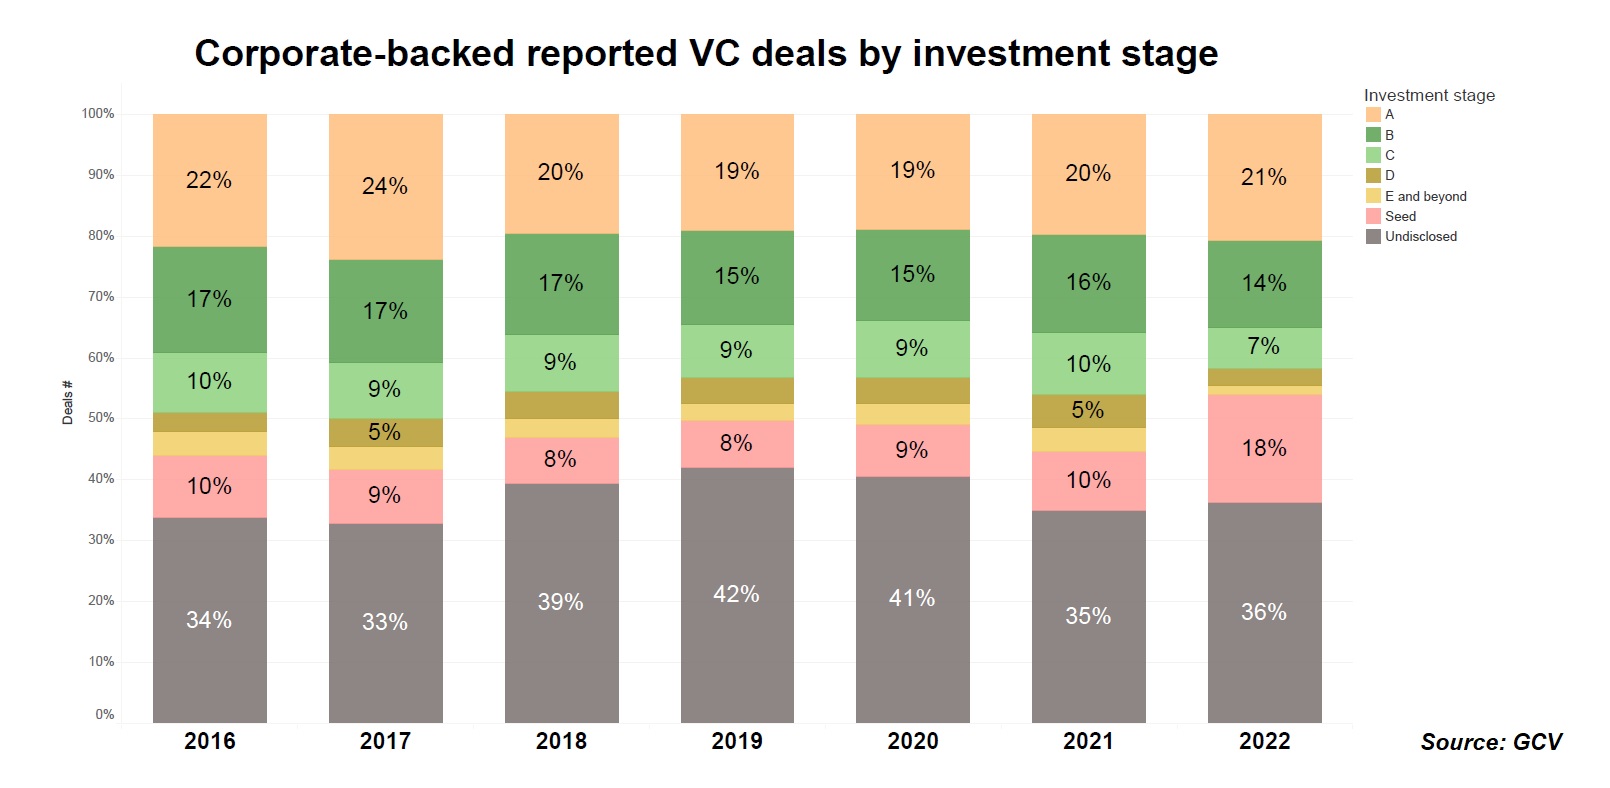
- CVC investors shift to seed stage investing
- Corporate-backed deals account for 19% of global VC funding activity
The paths of corporate venture investors and the rest of venture capital diverged dramatically last year. In a year which saw venture capital investors pull back from startup funding deals amid market turmoil, corporate investors remained much more steady. While the overall number of VC funding rounds fell by 25% from the previous year, rounds that included a corporate backer declined just 2%.
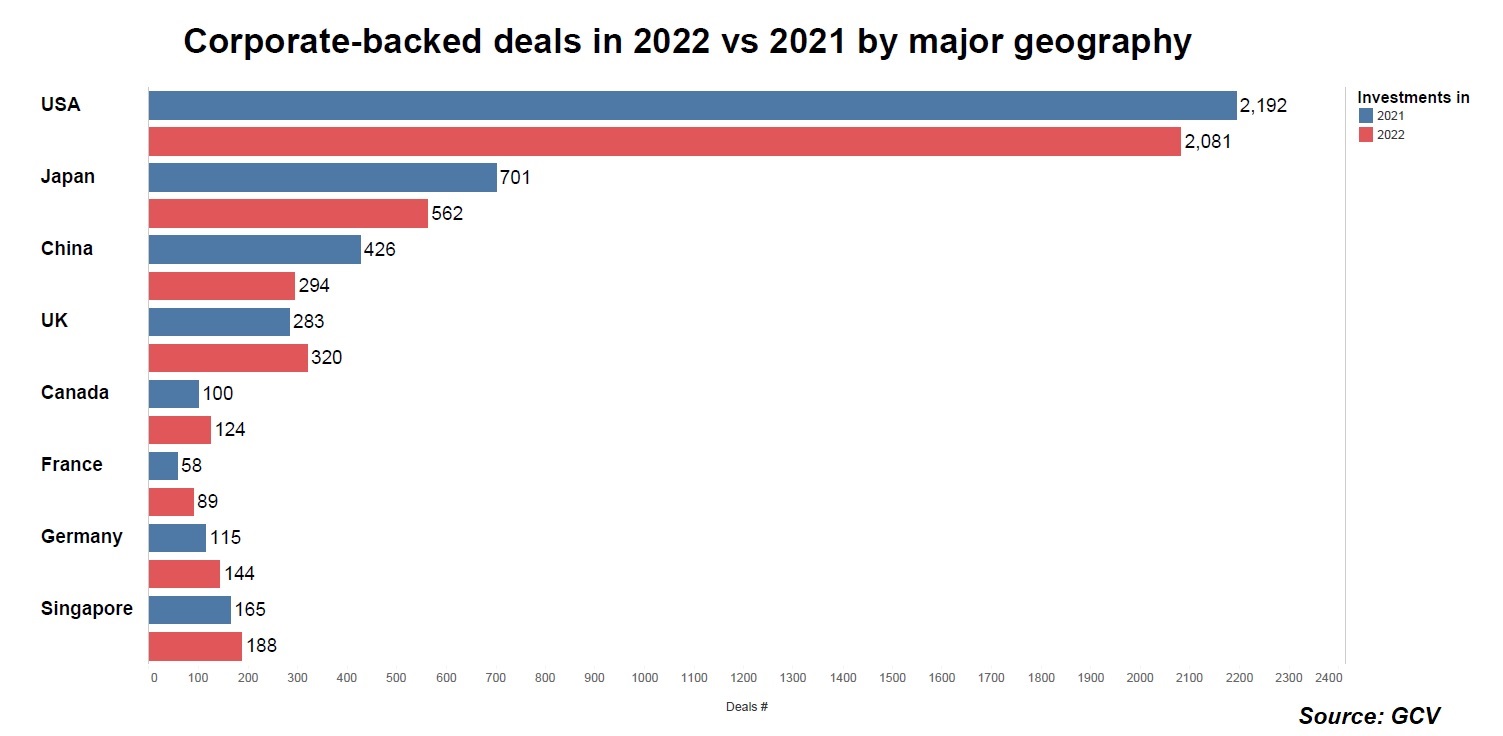
In some geographies, such as Western Europe and Canada, corporate investors even managed to increase the number of deals they did in 2022 from the previous year.
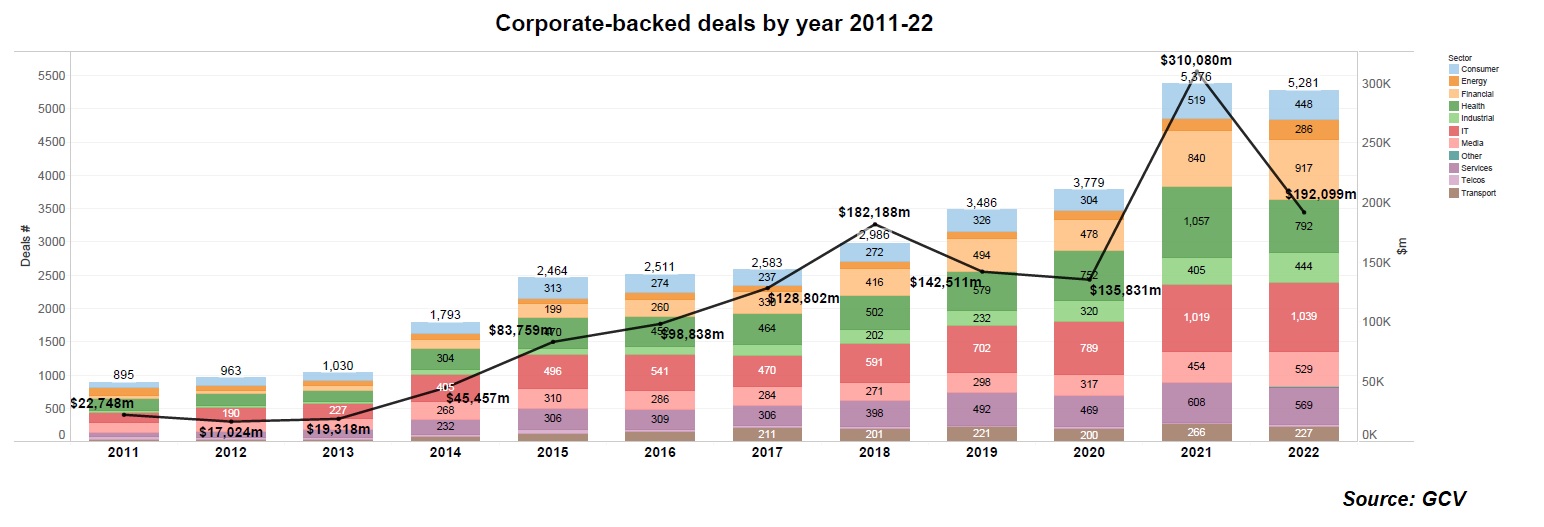
The number of dollars spent by both VC investors and their corporate counterparts both declined. The total estimated dollar value of VC deals went down 42%, from $632bn in 2021 to $369bn last year, while corporate-backed deal spend dropped 38% from $301bn to $192bn.
Corporate investors in many cases made a shift to earlier stage funding rounds — we saw an increase in the percentage corporate-backed deals that were seed rounds from 10% in 2021 to 18% in 2022. We had already noted this trend earlier in 2022. They may have spent less but they remained active in the market.
Far from pulling back, we saw a record 101 new corporate investment units created last year. We consider “new CVCs” those funds that have a corporate either as the one and only general partner (GP) or as the main limited partner (LP) in cases when the unit is managed by traditional VC firm.
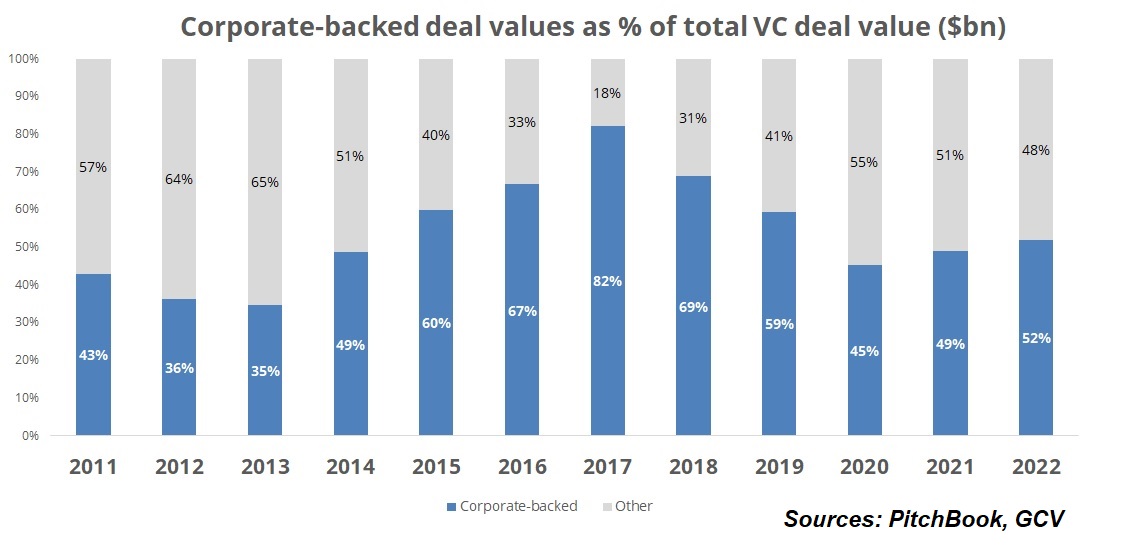
Deals involving corporate backers now account for 19% of all VC deals done globally — up from 15% last year.
UK, France, Germany, Canada and Singapore show growth
In 2022, GCV tracked 5,281 corporate-backed funding deals worth an estimated $192bn of total capital raised. That is 38% in dollar terms from the $310bn we tracked in 2021, but the number of deals has come down just 2% from 5376 deals in 2021.
Corporate venture funding has often tracked general VC activity closely, moving up and down in line with general trends. But 2022 saw corporate venture investors break that pattern.
Roughly four out of every 10 tracked corporate-backed transactions in 2022 took place in the US (a total of 2,081). Other notable innovation geographies on the global scene were Japan (562), the UK (320), India (307) and China (294).
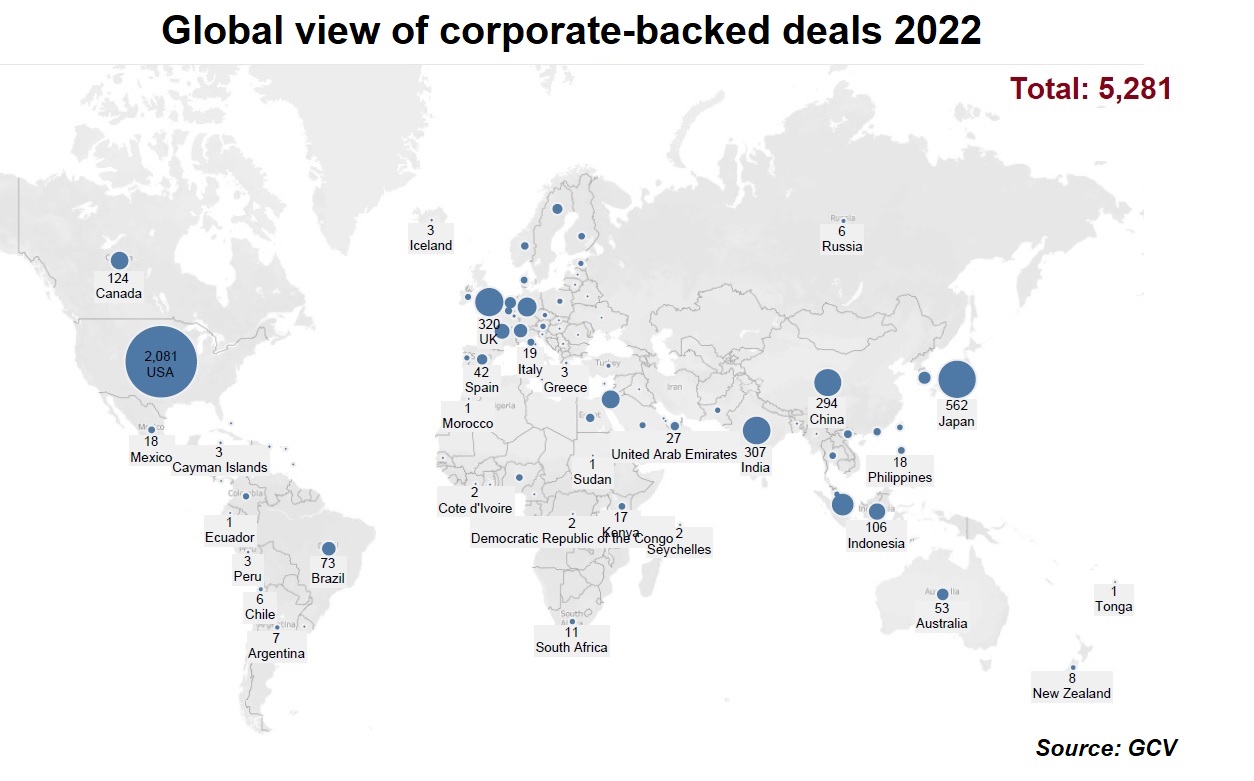
These were also the areas that saw the sharpest drop in the number of deals. But there was growth in the number of corporate-backed deals in the UK (320 last year vs 283 in 2021), Canada (124 vs 100), Germany (144 vs 115), France (89 vs 58) and Singapore (188 vs 165). Although it is worth noting that even when combined, the number of deals in these countries is less than half the volume of the US.
New and repeat investors
The big question hanging over corporate investors has always been: will they remain active during tough economic times? Previous economic downturns have usually seen corporates retreat from startup funding, and currently monetary tightening by central banks, Russia’s war on Ukraine and resulting energy crisis are all combining to create extremely tough financial conditions.
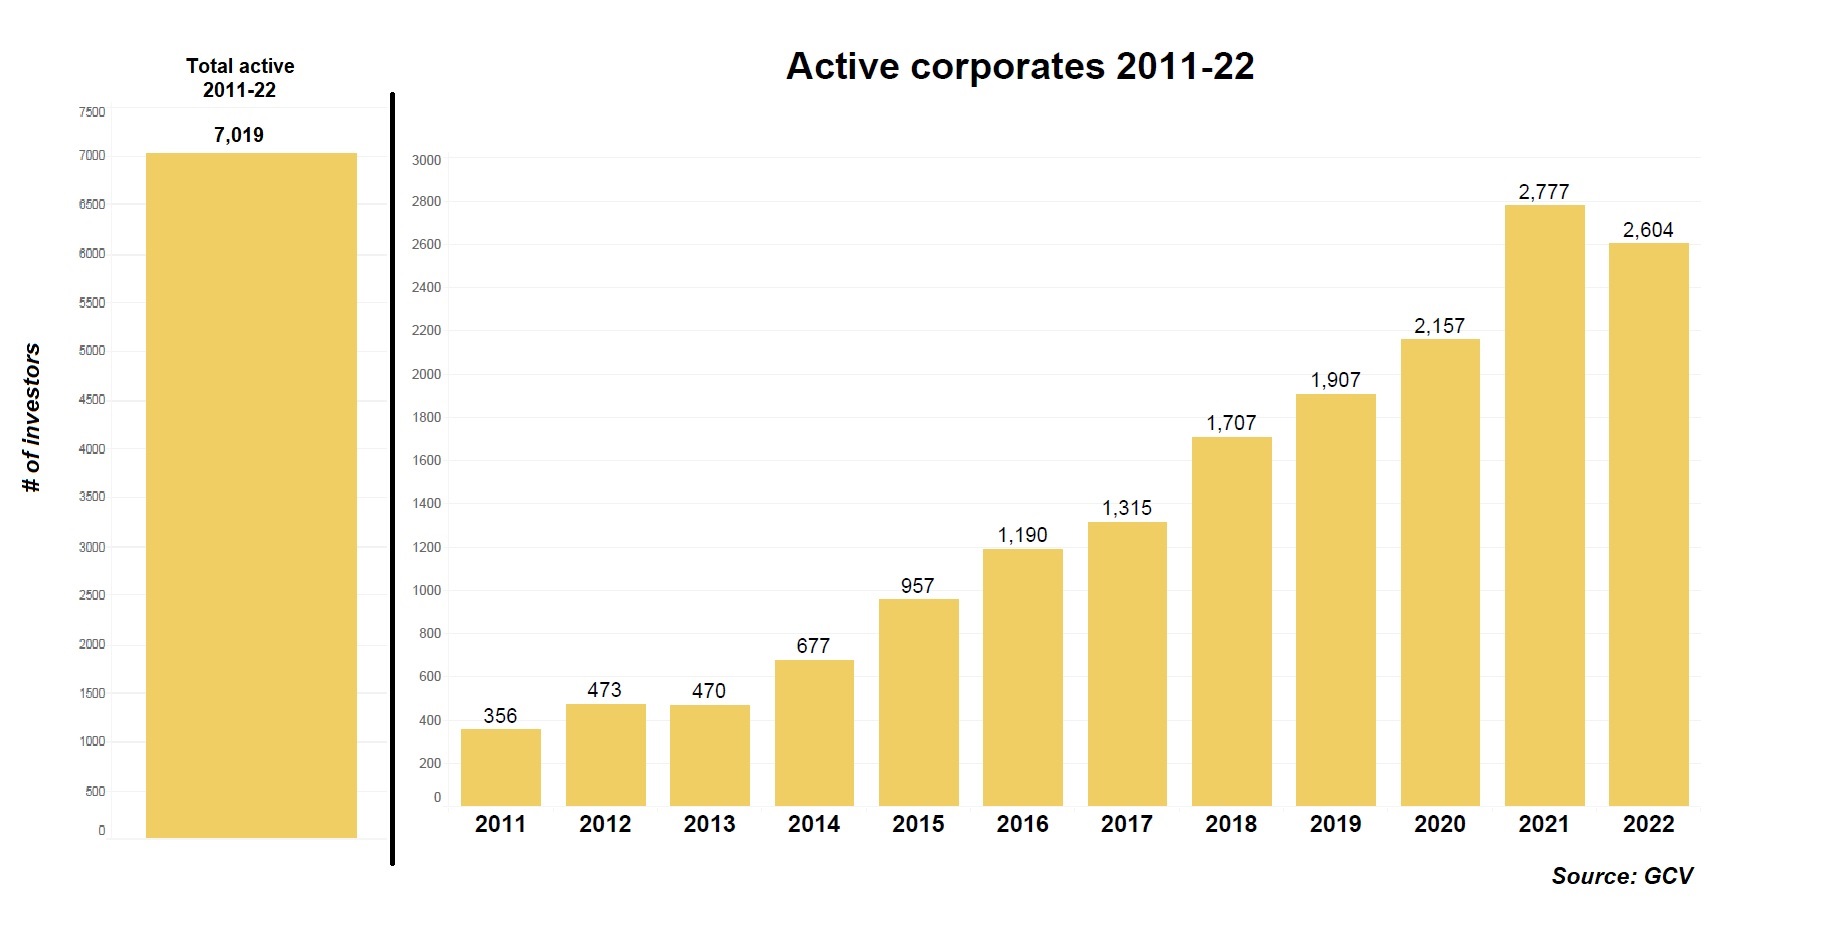
The number of active corporate investors did drop in 2022, when we saw only 2604 units actively participate in at least one deal, compared to 2,777 the previous year. But the number of active investors is still far ahead of 2020.
Since 2011, when we first started our trade publication, GCV has tracked over 7,000 distinct corporate investors – with or without a formal investment unit – which have taken a minority stake in at least one deal. The number of actively investing in any given year has gone up multifold from 473 in 2012.
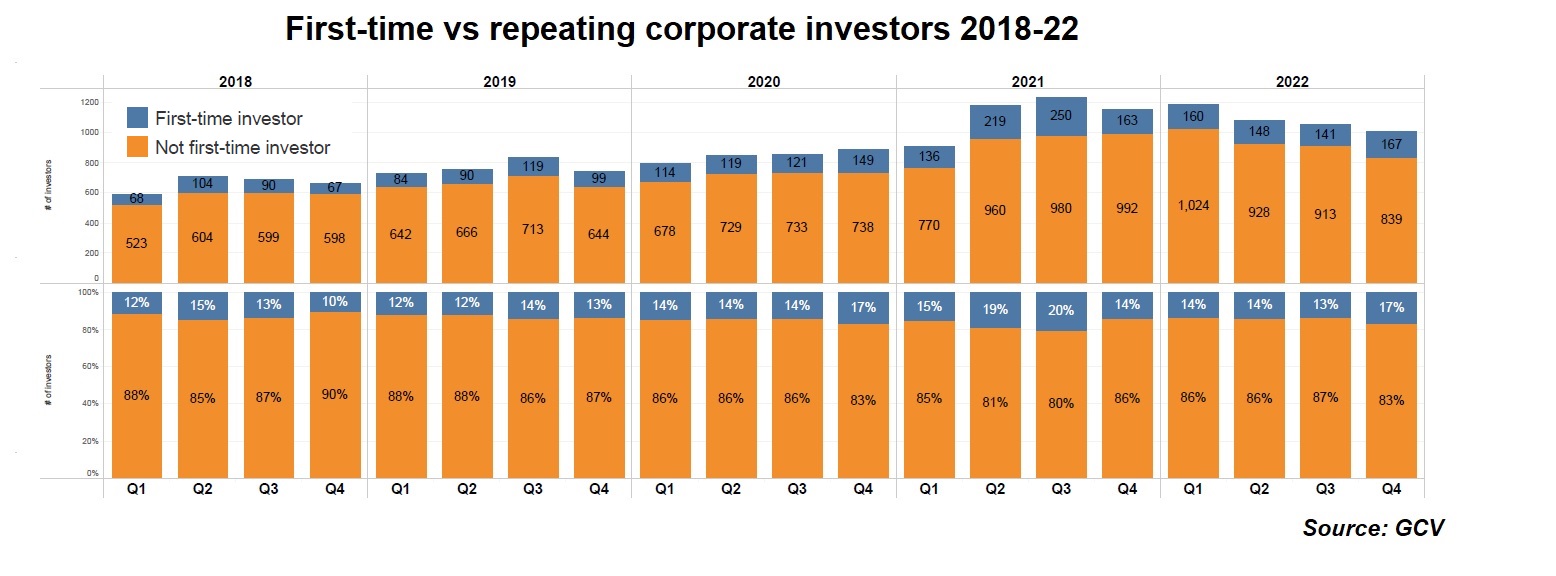
Moreover, our data suggest that 14-17% of all corporate investors we track quarterly were first-time investors throughout the four quarters of 2021.
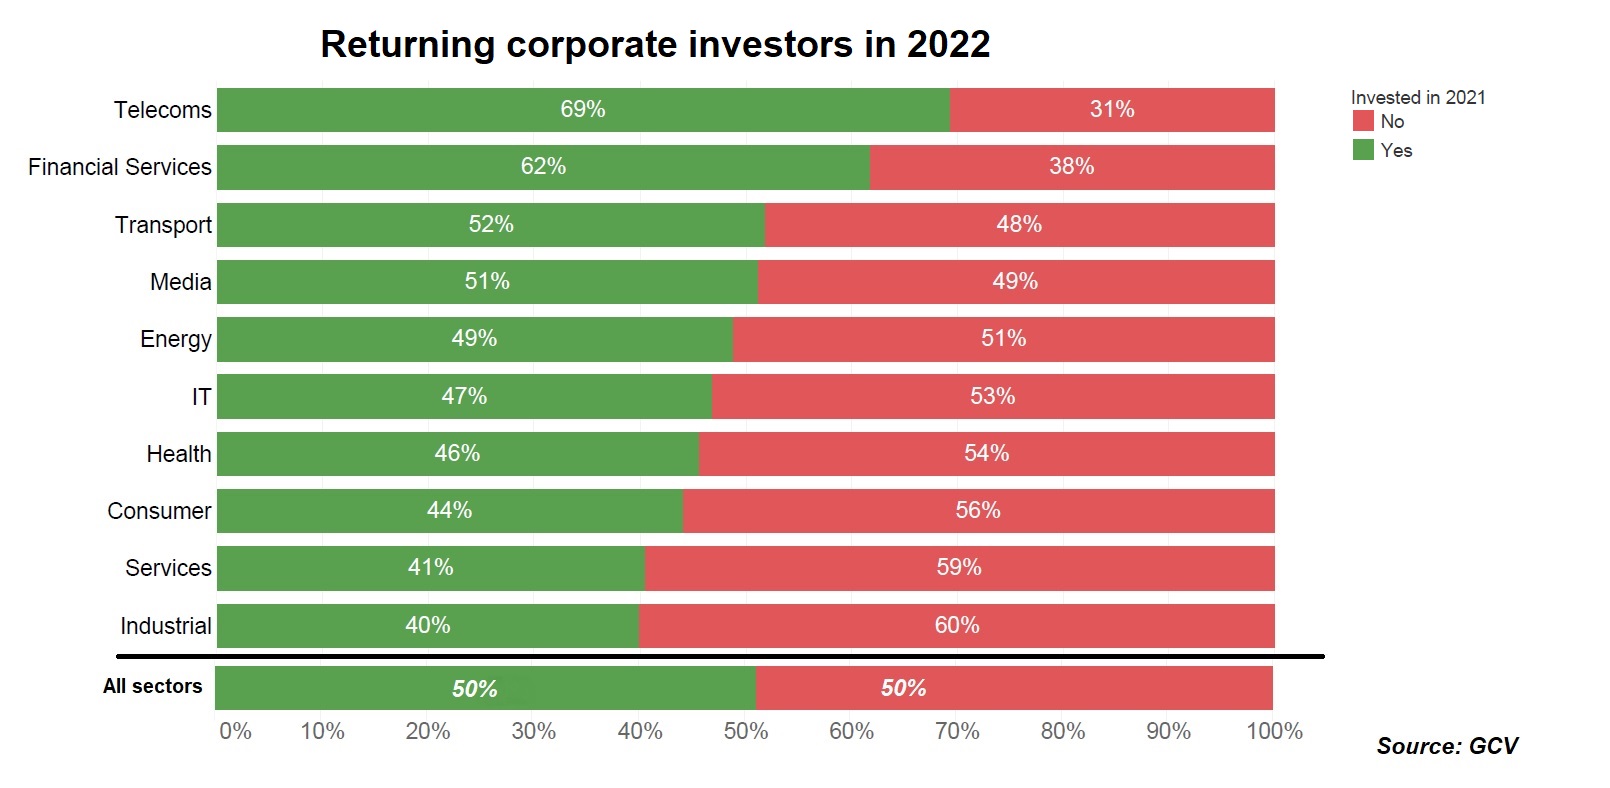
Corporate investors are also coming back to make more than one investment. Overall, half of all corporate investors that had participated in at least one minority stake round in 2021 made a further investment last year. Serial investing is particularly high in sectors like telecoms (69%), financial services (62%), transport (52%) and media (51%).
Bursting the 2021 bubble
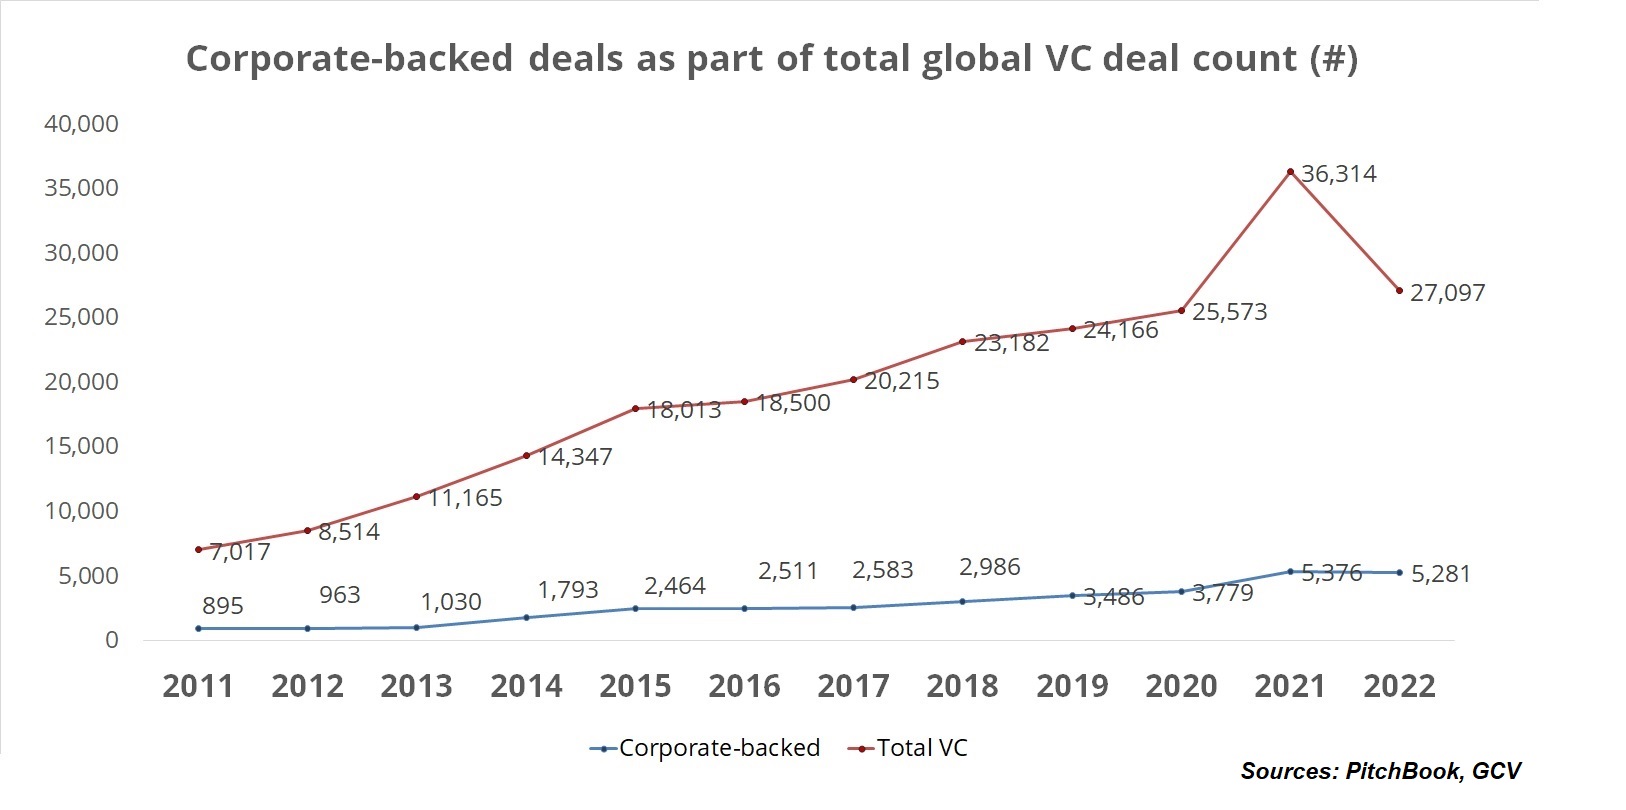
According to PitchBook, overall venture capital activity fell 25% from 36,314 deals to 27,097 by the end of 2022, as the investment frenzy of 2021 faded. Meanwhile corporate-backed deals, which were slower to rise in 2021, were also slower to fall in 2022.
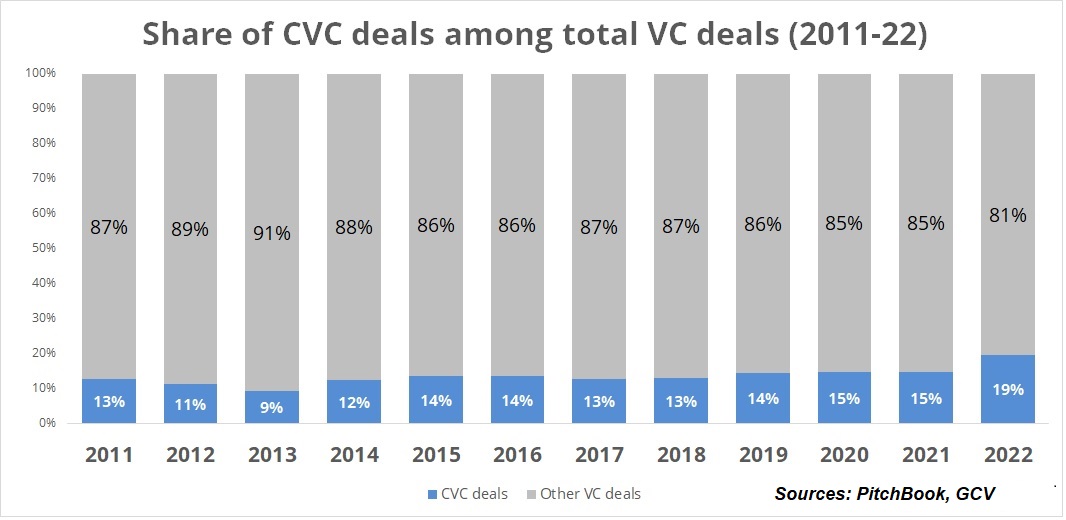
This has left the corporate-backed deals as a higher share of total VC deals. Some 19% of funding rounds now include a corporate backer, the highest we have seen since GCV began tracking (note: this is a global figure encompassing not just the United States).
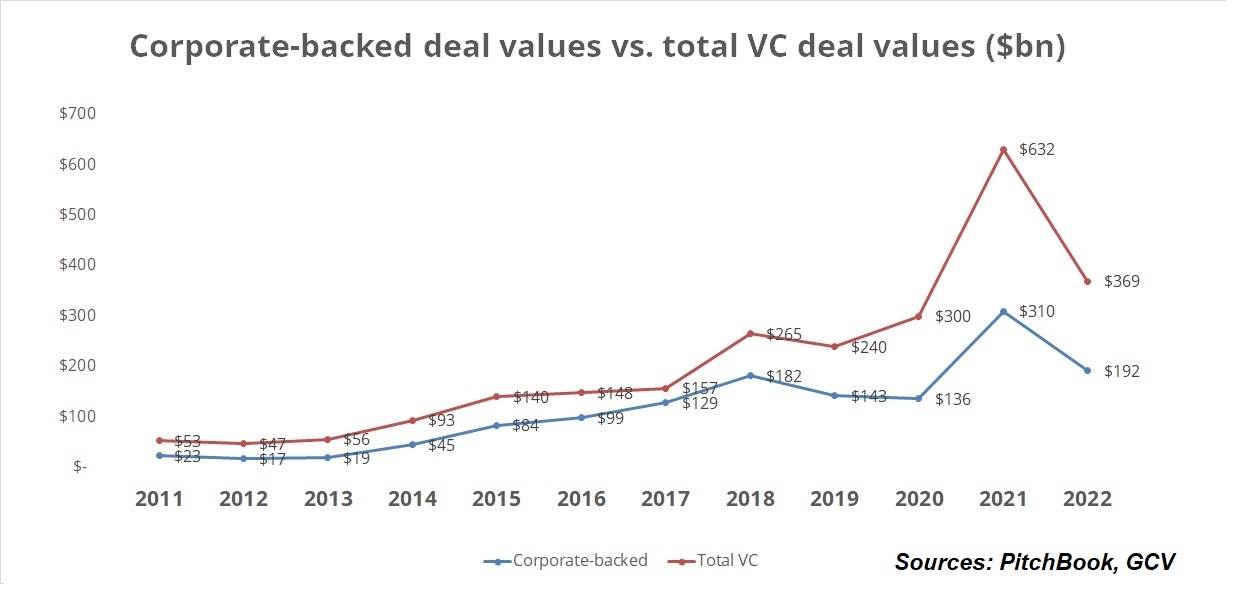
Data from both PitchBook and GCV suggest that total capital in corporate-backed rounds shrunk at similar pace along with total capital in all venture rounds over the last year. While both grew to all-time-highs and reached a peak in 2021, they nosedived last year. In the total VC global arena, estimated dollars went down 42% from $632bn in 2021 to $369bn in 2022. The drop in total estimated dollar value of corporate-backed deals was similar (-39%) from $310bn to $192bn.
Where are corporates investing?
Crporate investors appear to be looking for opportunities in earlier-stage companies. Seed rounds accounted for 18% of all corporate-backed deals in 2022, up from 10% in 2021. This is the highest percentage we have seen since we have been tracking corporate deals.
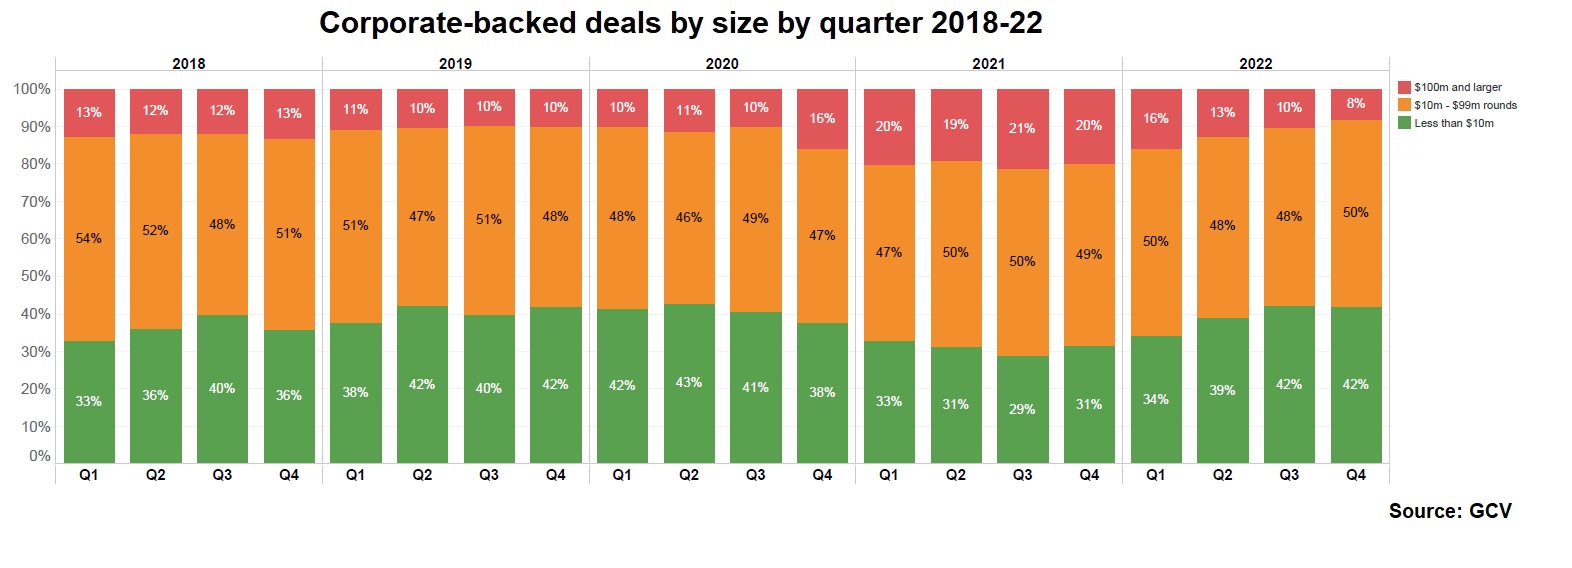
The same could be seen across deals when segmented by size. The relative share of deals sized below $10m grew from about a third of the total in the first two quarters of 2022 to 42% later in the year. Simultaneously, we saw the share of deals of $100m or larger shrink from 16% in Q1 of 2022 to 8% in Q4.
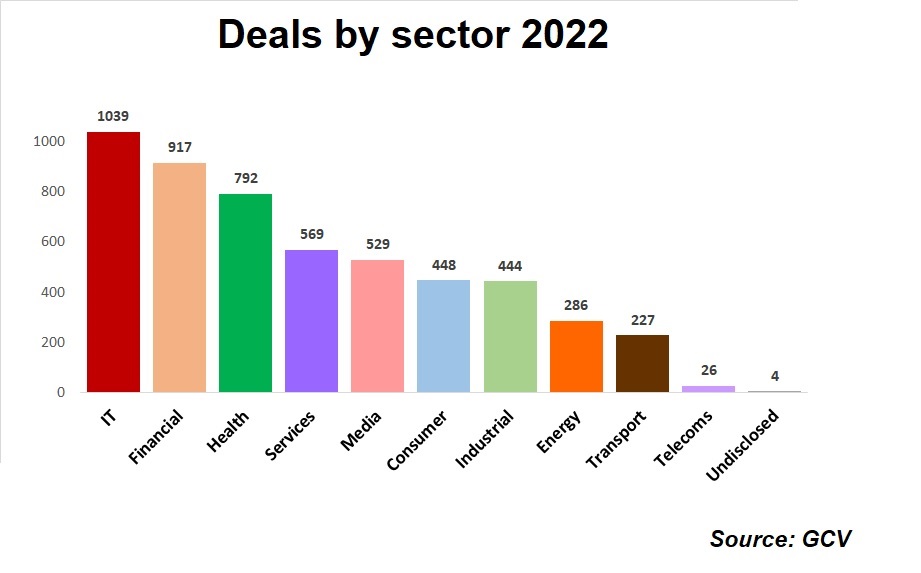
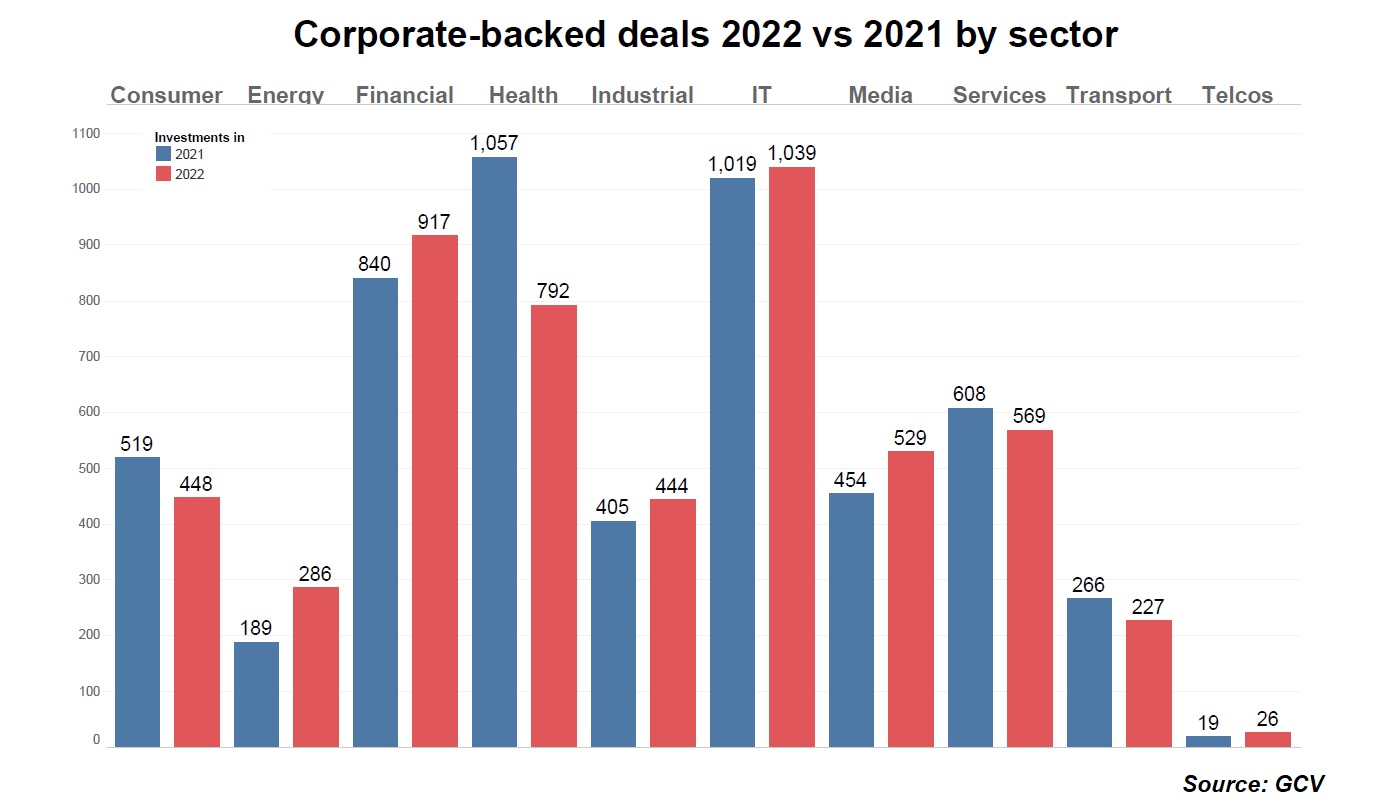
Six sectors accounted for the bulk of corporate-backed rounds – IT with 1,039 deals, financial services with 917, health with 792, business services with 569, media with 529 and consumer with 448.
Most sectors saw deal numbers fall in 2022, except for IT and telecoms (only marginally higher), energy (286 round vs 189) and media (529 vs 454). The increase of deals in energy and media sectors was driven by cleantech and gaming.
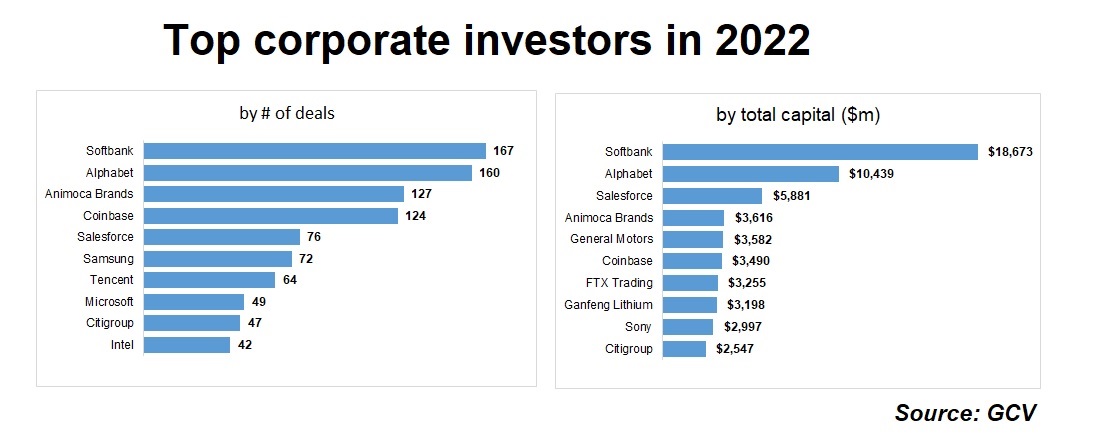
Top corporate investors for 2022 included telecoms and internet company SoftBank with 167 deals, Google’s parent company Alphabet with 160 investments, game software company Animoca Brands (127) and crypto asset exchange Coinbase (124). The top three investors involved in the largest rounds were also SoftBank, Alphabet and cloud enterprise software Salesforce.
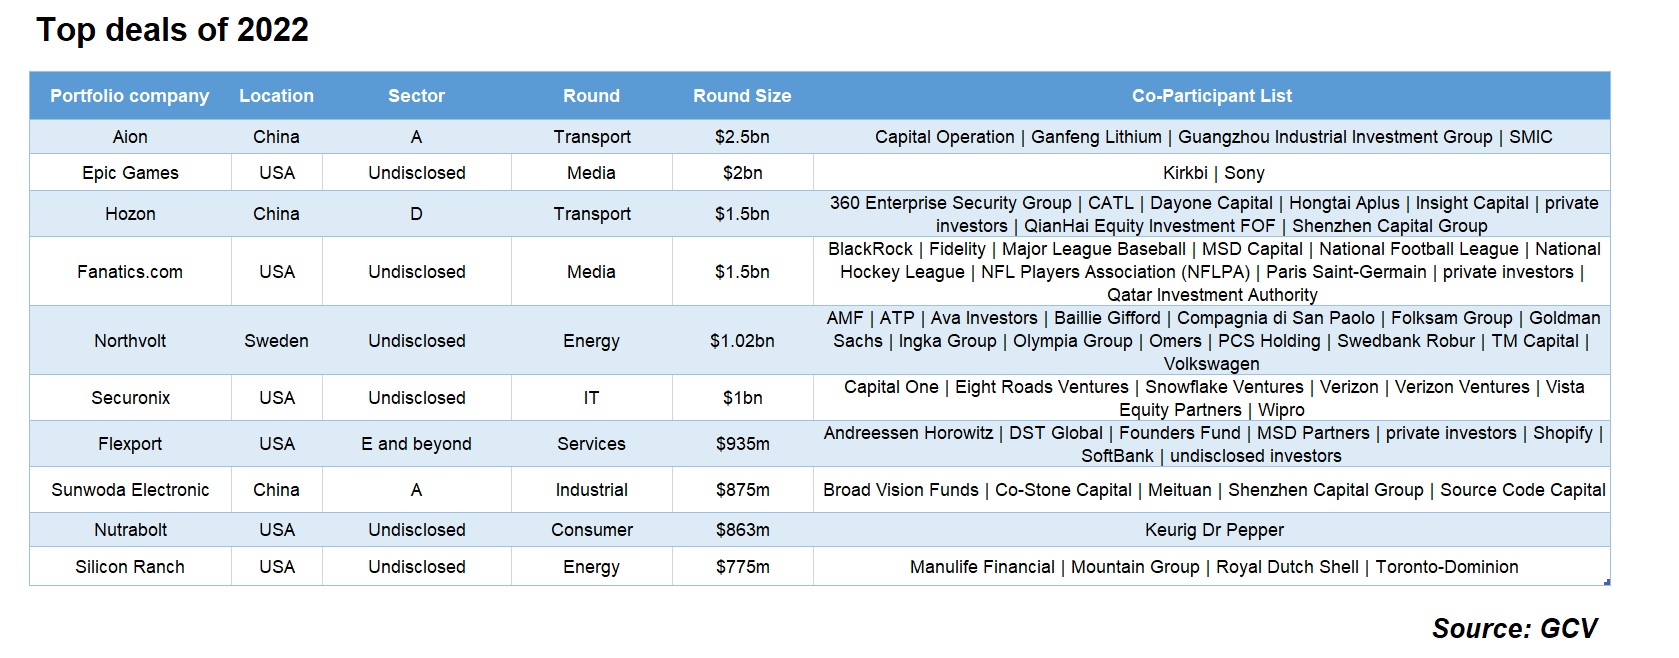
Top deals of 2022
Large deals still happened in 2022 — in fact, six of the top 10 deals stood well above the $1bn mark. The large deals reflected the key trends of 2022. Five of the largest 10 rounds were connected to the energy transition theme – whether in the form of electric vehicles or batteries or renewable energies. Aside from those deals, we also saw big rounds raised by some non-cyclical businesses (cybersecurity, nutrition), logistics, gaming and even e-commerce. Read our deep dive on what these large rounds told us here: “The 10 biggest CVC deals of 2022 and what they tell us.”
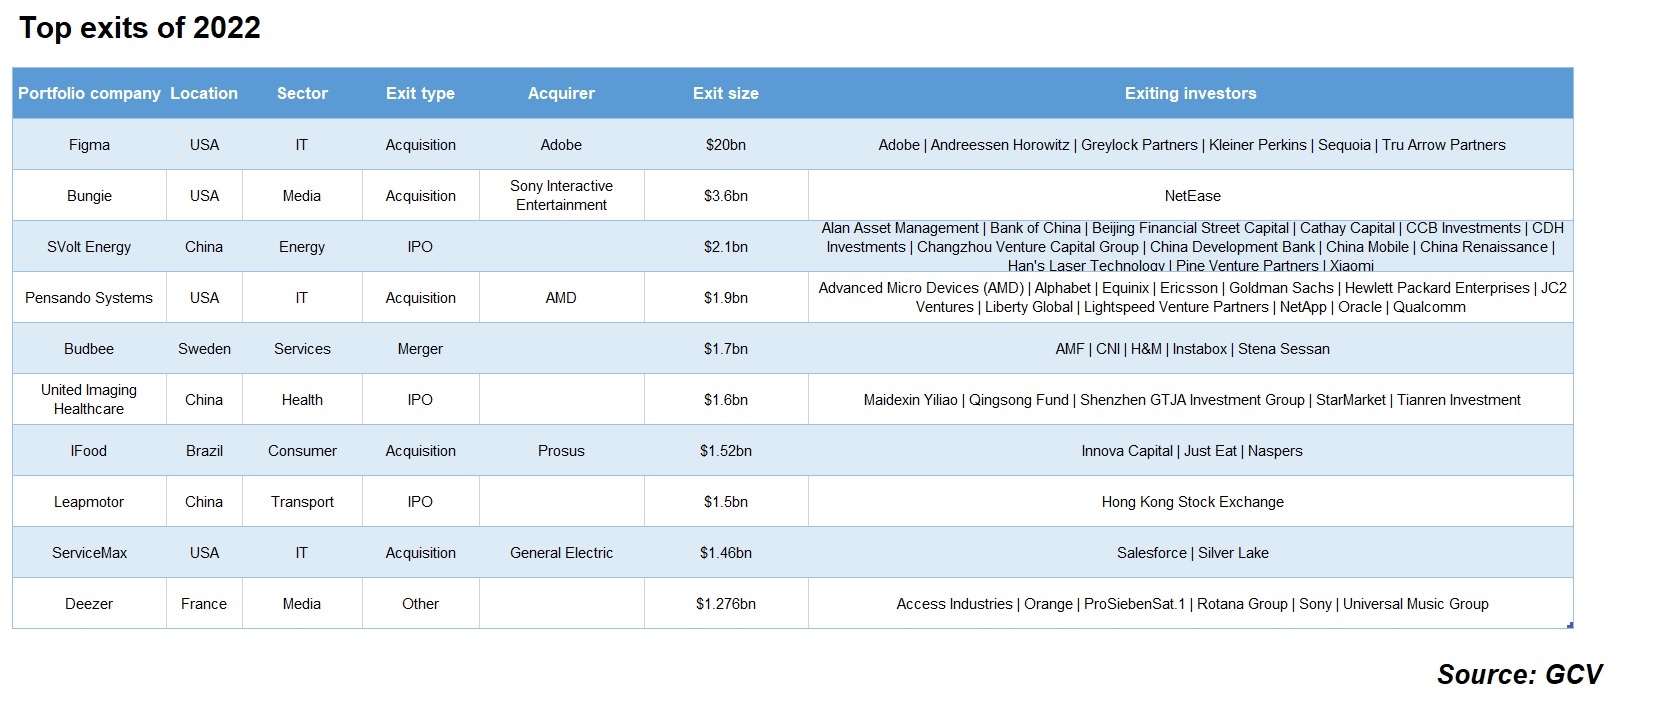
Top exits of 2022
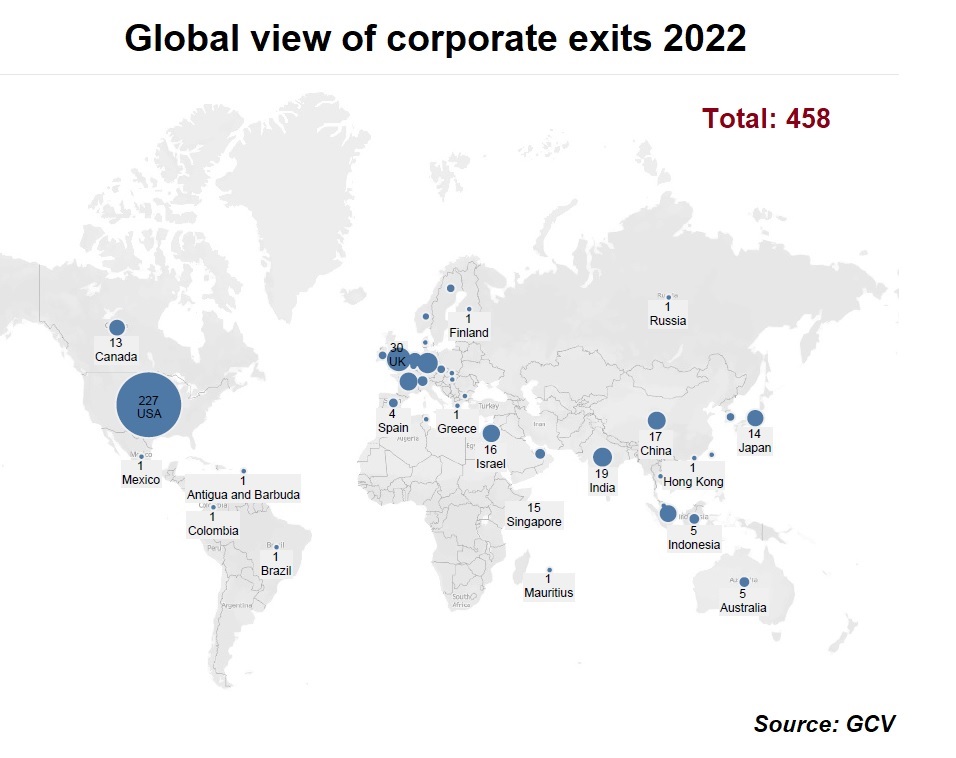
A pullback in the IPO markets in 2022 meant fewer deals. GCV Analytics tracked 458 exits involving corporate venturers and companies backed by such investors, a 31% decrease from the previous year’s 658.
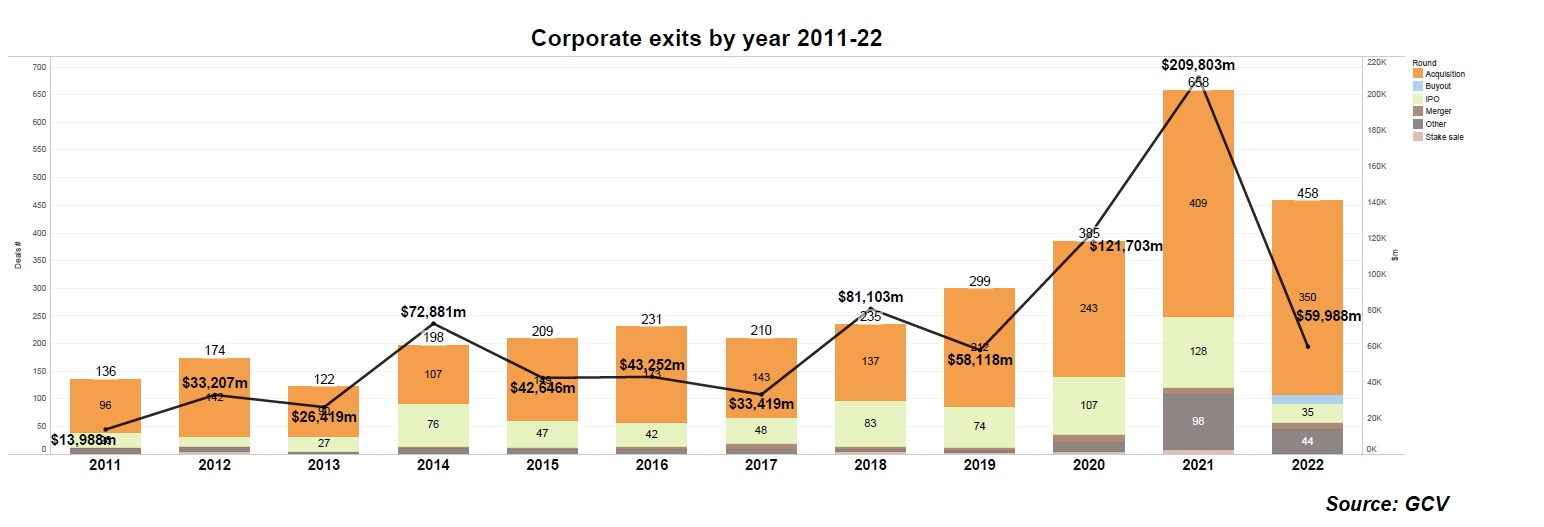
The US hosted 227 of those transactions, followed by the UK (30), India (19), China (17), Israel (16) and Japan (14). The total estimated capital involved in the exits stood at $59.99bn, 71% below the $209.8bn registered in 2021.
Most of the top exits in 2022 were acquisitions, although a handful of high-profile initial public offerings (IPOs) or IPO filings did take place.
Record number of new CVCs
One notable trend, which we observed in 2022 data is that, despite the bear market, there seemed to be a record number of newly launched CVC units (some of the largest in size are discussed below) – 101 that we have reported.
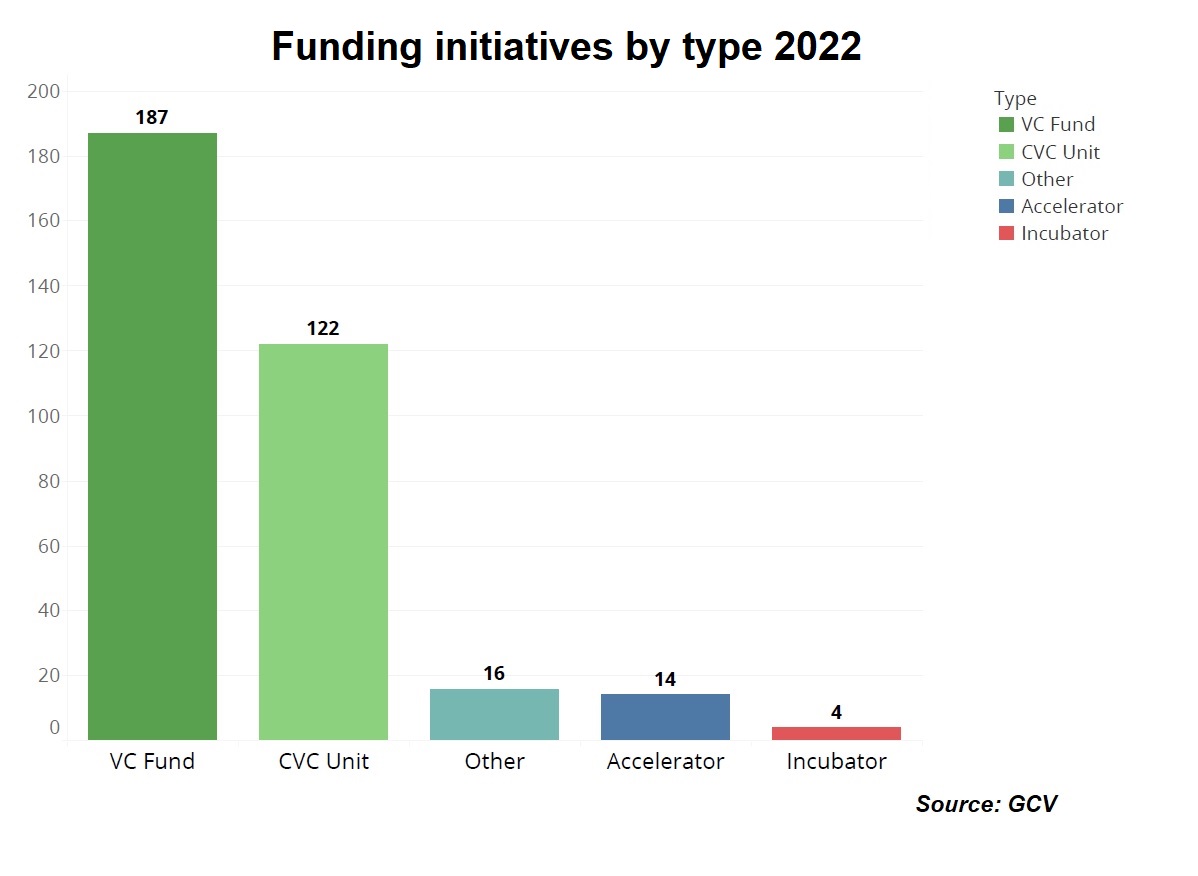
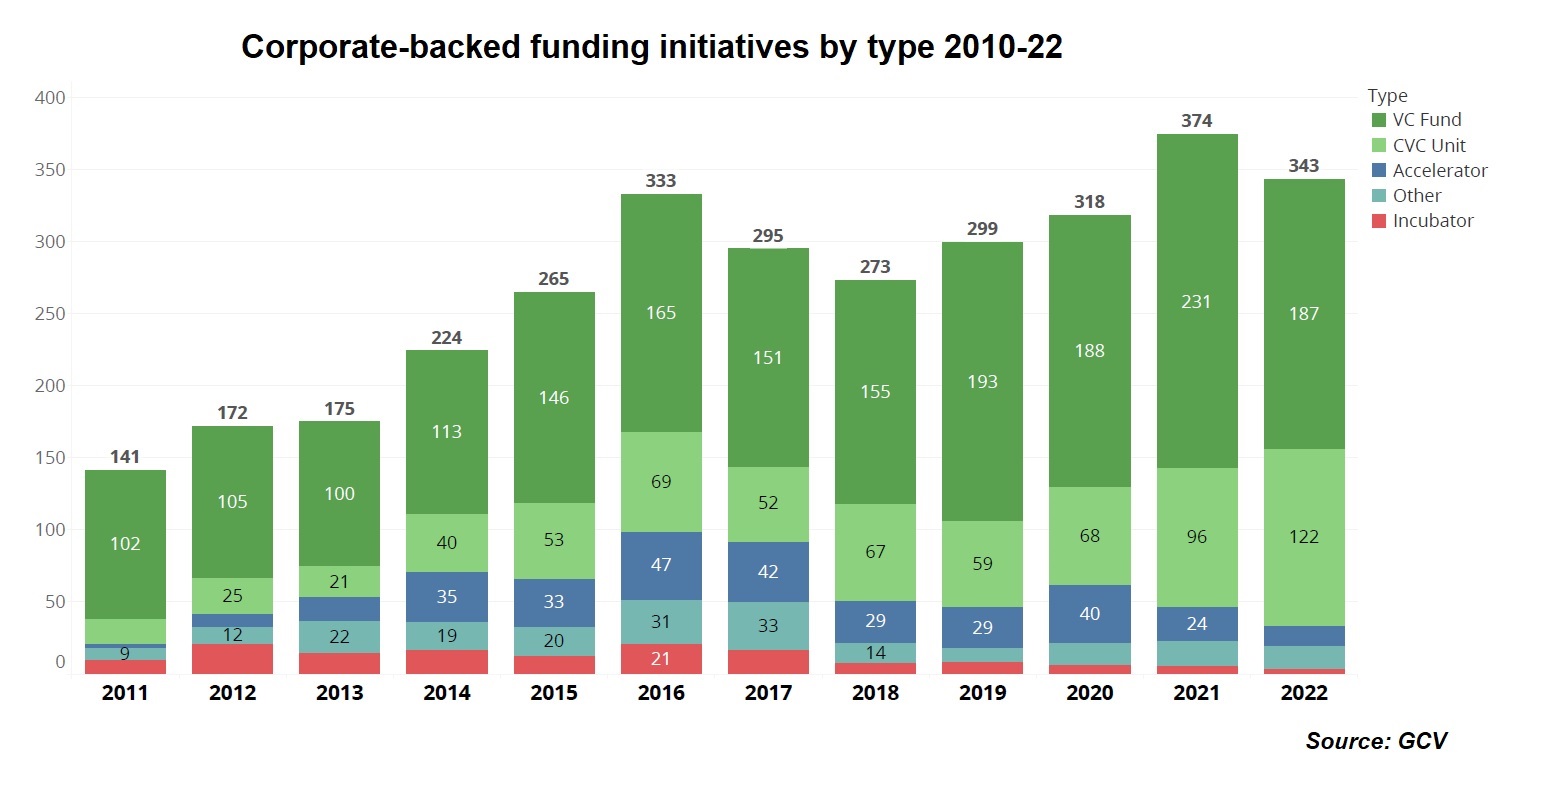
GCV tracked 343 funding initiatives that received corporate backing throughout 2022 including 187 venture funds, where a corporate investor was one of many LPs in the fund and 127 venturing units where the corporate was the sole investor.
Of these 127 venture units, 101 were new and 26 were rebranded or recapitalised. In addition, we also tracked 14 corporate-backed accelerators, four corporate-backed incubators and 16 other initiatives.
Most of these initiatives were set up in North America (131), Asia (107) and Europe (66), with the latter being the only one of the major innovation regions where such initiatives increased in number vis-à-vis last year.
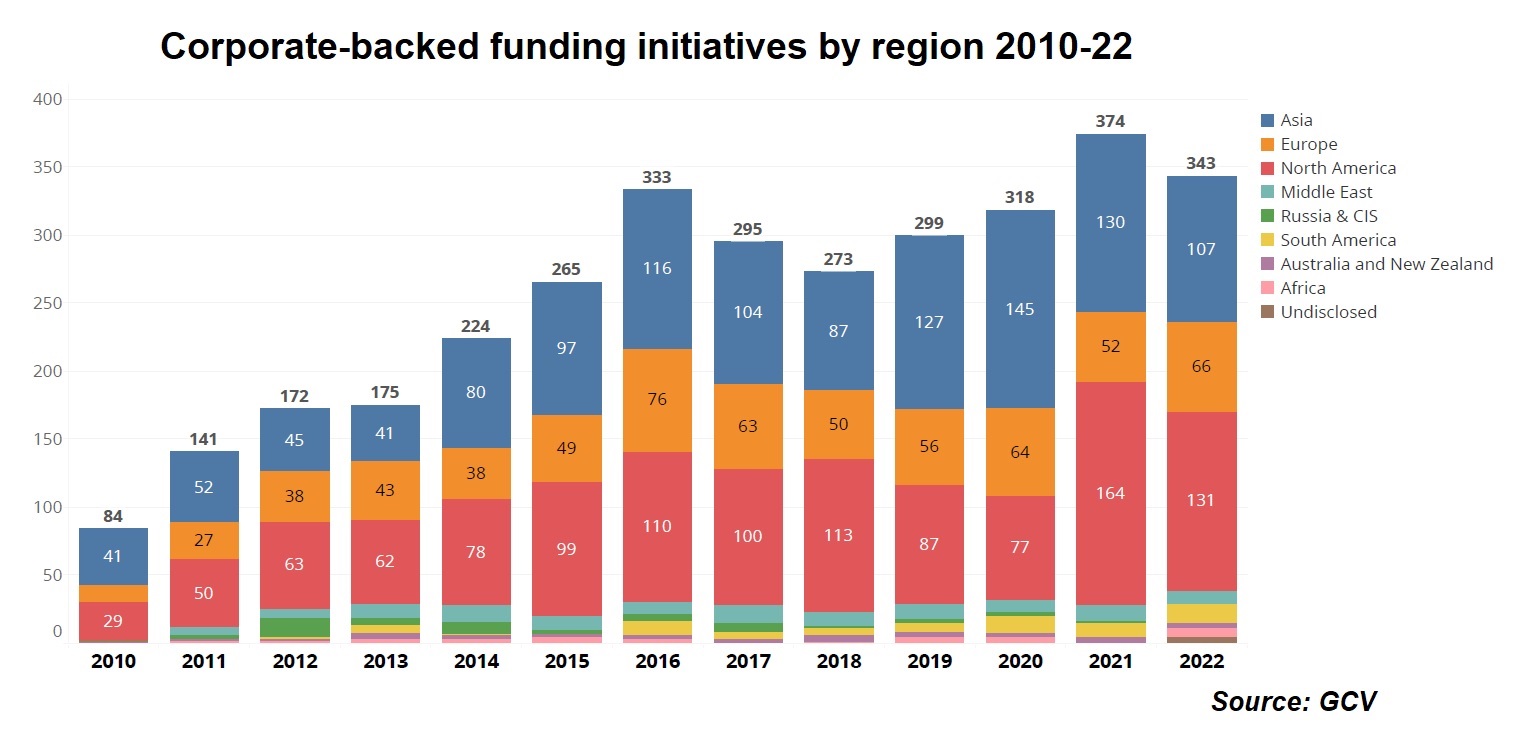
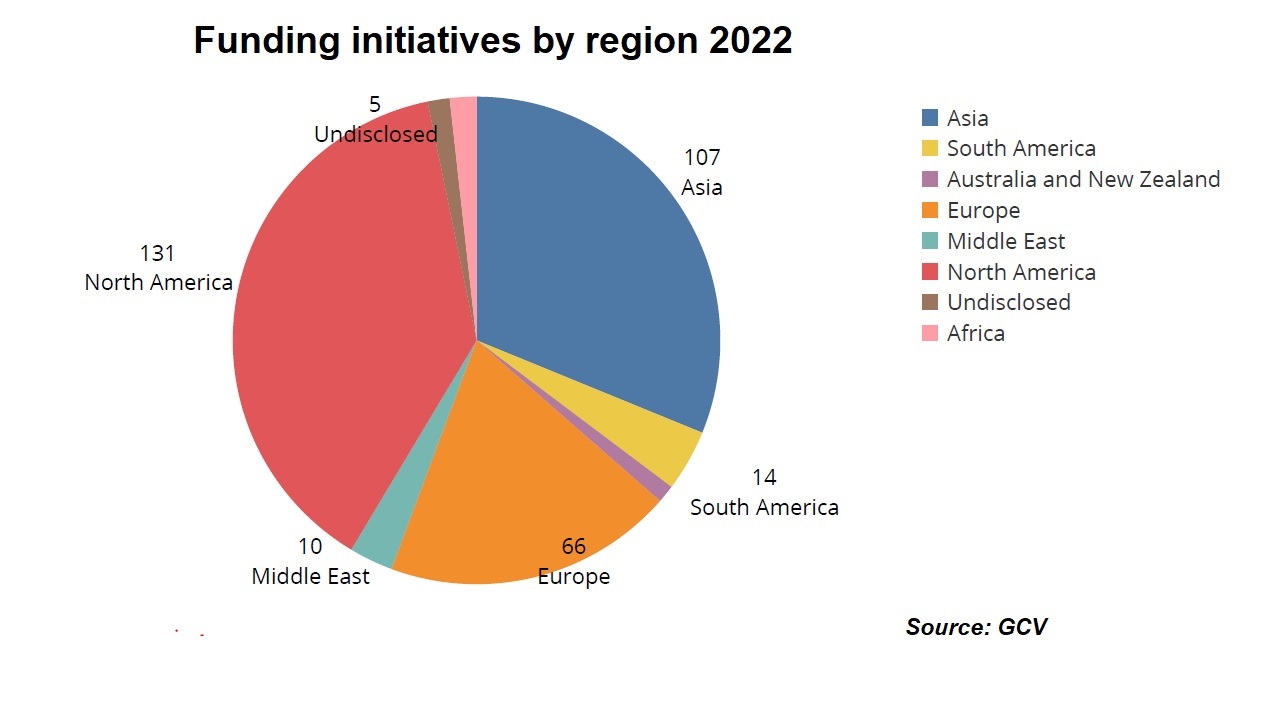
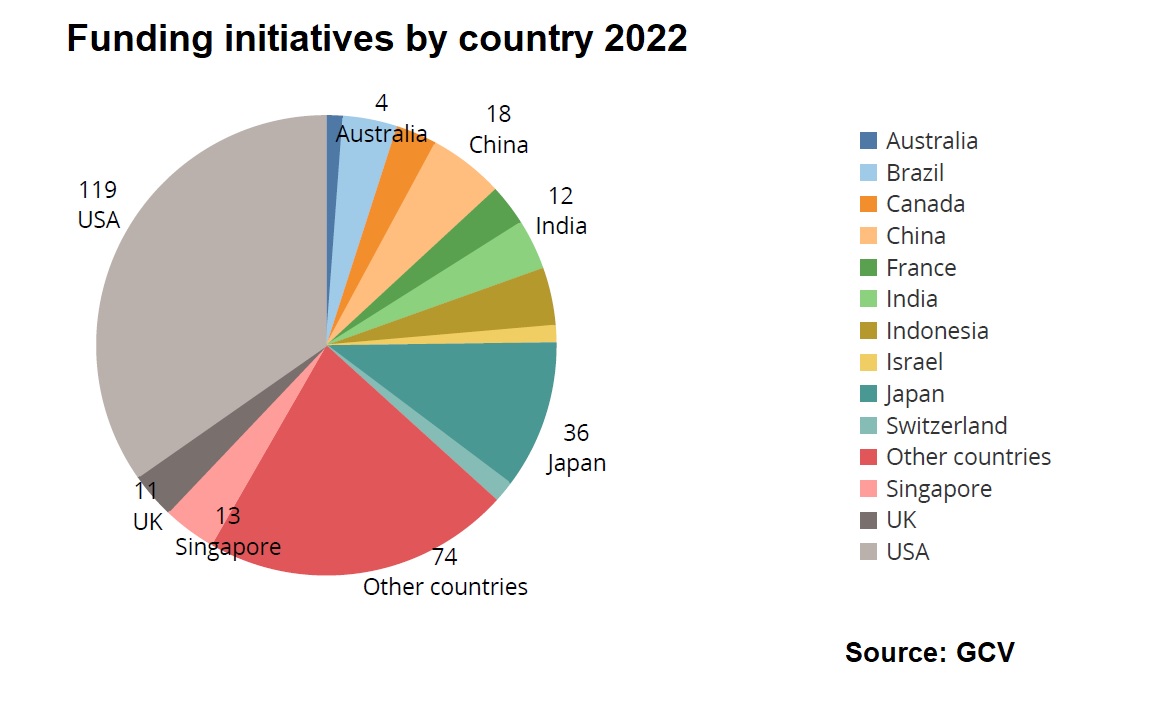
The countries that hosted the largest number of such initiatives were the US (119), Japan (36) and China (18).
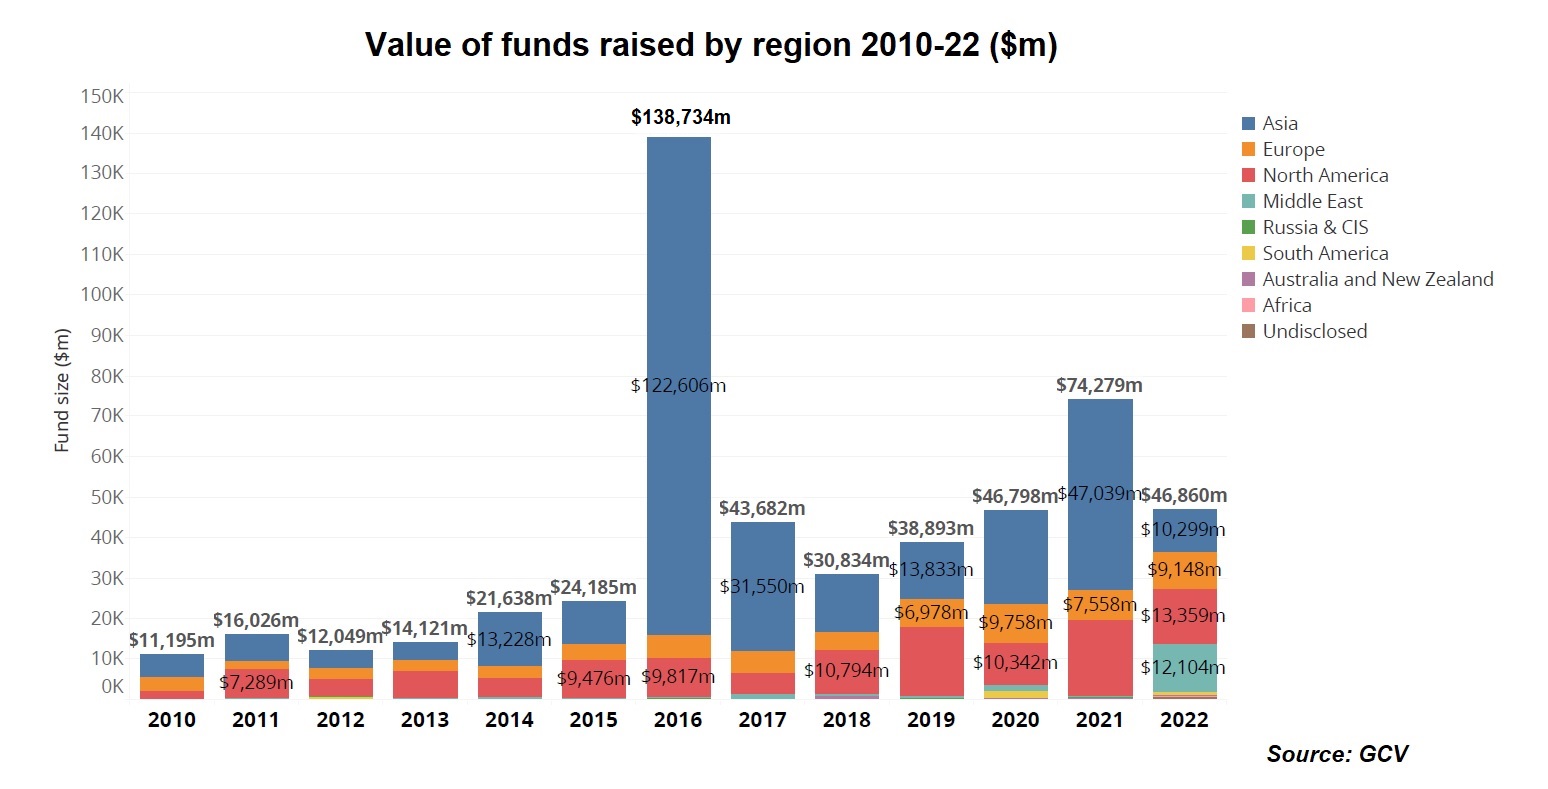
The overall number of corporate-backed initiatives registered a 9% decrease compared with the 374 we reported in 2021. The total estimated size of the initiatives ($46.86bn) was 37% lower than the 2021 figure of $74.28bn, though this was largely due to the effect of one large fund – the $30bn Vision Fund 2 in the 2021.
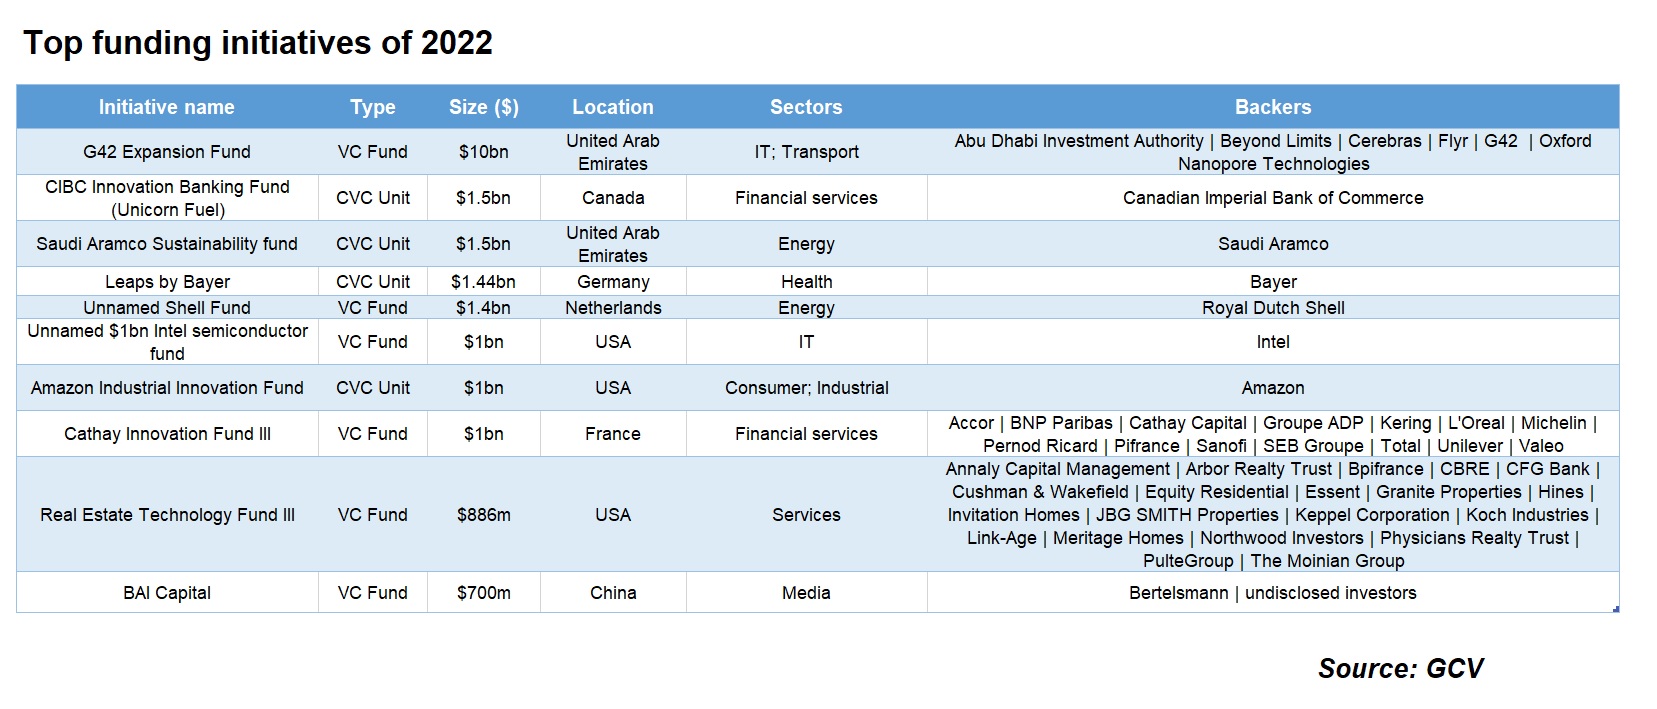
Top funding initiatives
Eight of the top ten largest corporate-backed initiatives stood at or above the $1bn mark. Their focus spans through everything that may conceivably be hot in the coming years – from sustainability, cleantech through consumer tech, media and life sciences to financial services and real estate.
Kaloyan Andonov
Kaloyan Andonov is head of analytics at Global Corporate Venturing.